Resource
| Id | DNase-seq/ENCSR100OSB |
|---|---|
| Type | position_score |
| Version | 0 |
| Summary | DNase-seq ENCSR100OSB [biosample_summary="Homo sapiens activated naive CD4-positive, alpha-beta T cell male adult (42 years) treated with 50 U/mL Interleukin-2 for 16 hours"] |
| Description |
status: released biological_replicates: Rep 1 summary: male adult (42 years) treated with 50 U/mL Interleukin-2 for 16 hours output_type: peaks |
| Labels |
|
Scores (1)
| ID | Type | Default annotation | Description | Histogram | Range | Summary |
|---|---|---|---|---|---|---|
| DNase-seq_ENCSR100OSB | float |
DNase-seq_ENCSR100OSB |
DNase-seq ENCSR100OSB [biosample_summary="Homo sapiens activated naive CD4-positive, alpha-beta T cell male adult (42 years) treated with 50 U/mL Interleukin-2 for 16 hours"]
|
 |
[0.0602, 78.1] |
|
n counts base pairs; sd is the population standard deviation.
Coverage
| Chromosome | Covered positions | Covered % | Segments |
|---|---|---|---|
| all chromosomes | 14349339 | 0.45% | 74123 |
| chr1 | 1466269 | 0.59% | 7521 |
| chr2 | 1028374 | 0.42% | 5365 |
| chr3 | 761955 | 0.38% | 3971 |
| chr4 | 469858 | 0.25% | 2399 |
| chr5 | 626885 | 0.35% | 3303 |
| chr6 | 836035 | 0.49% | 4307 |
| chr7 | 638193 | 0.40% | 3325 |
| chr8 | 561600 | 0.39% | 2914 |
| chr9 | 587112 | 0.42% | 3028 |
| chr10 | 680827 | 0.51% | 3532 |
| chr11 | 727337 | 0.54% | 3780 |
| chr12 | 714792 | 0.54% | 3681 |
| chr13 | 283970 | 0.25% | 1462 |
| chr14 | 496694 | 0.46% | 2559 |
| chr15 | 465107 | 0.46% | 2409 |
| chr16 | 604301 | 0.67% | 3091 |
| chr17 | 870336 | 1.05% | 4430 |
| chr18 | 231378 | 0.29% | 1196 |
| chr19 | 894048 | 1.53% | 4505 |
| chr20 | 408547 | 0.63% | 2137 |
| chr21 | 166300 | 0.36% | 880 |
| chr22 | 358060 | 0.70% | 1853 |
| chrX | 454397 | 0.29% | 2384 |
| chrY | 16964 | 0.03% | 91 |
| 3342 contigs with no values (129077085 bp) | 0 | 0.00% | 0 |
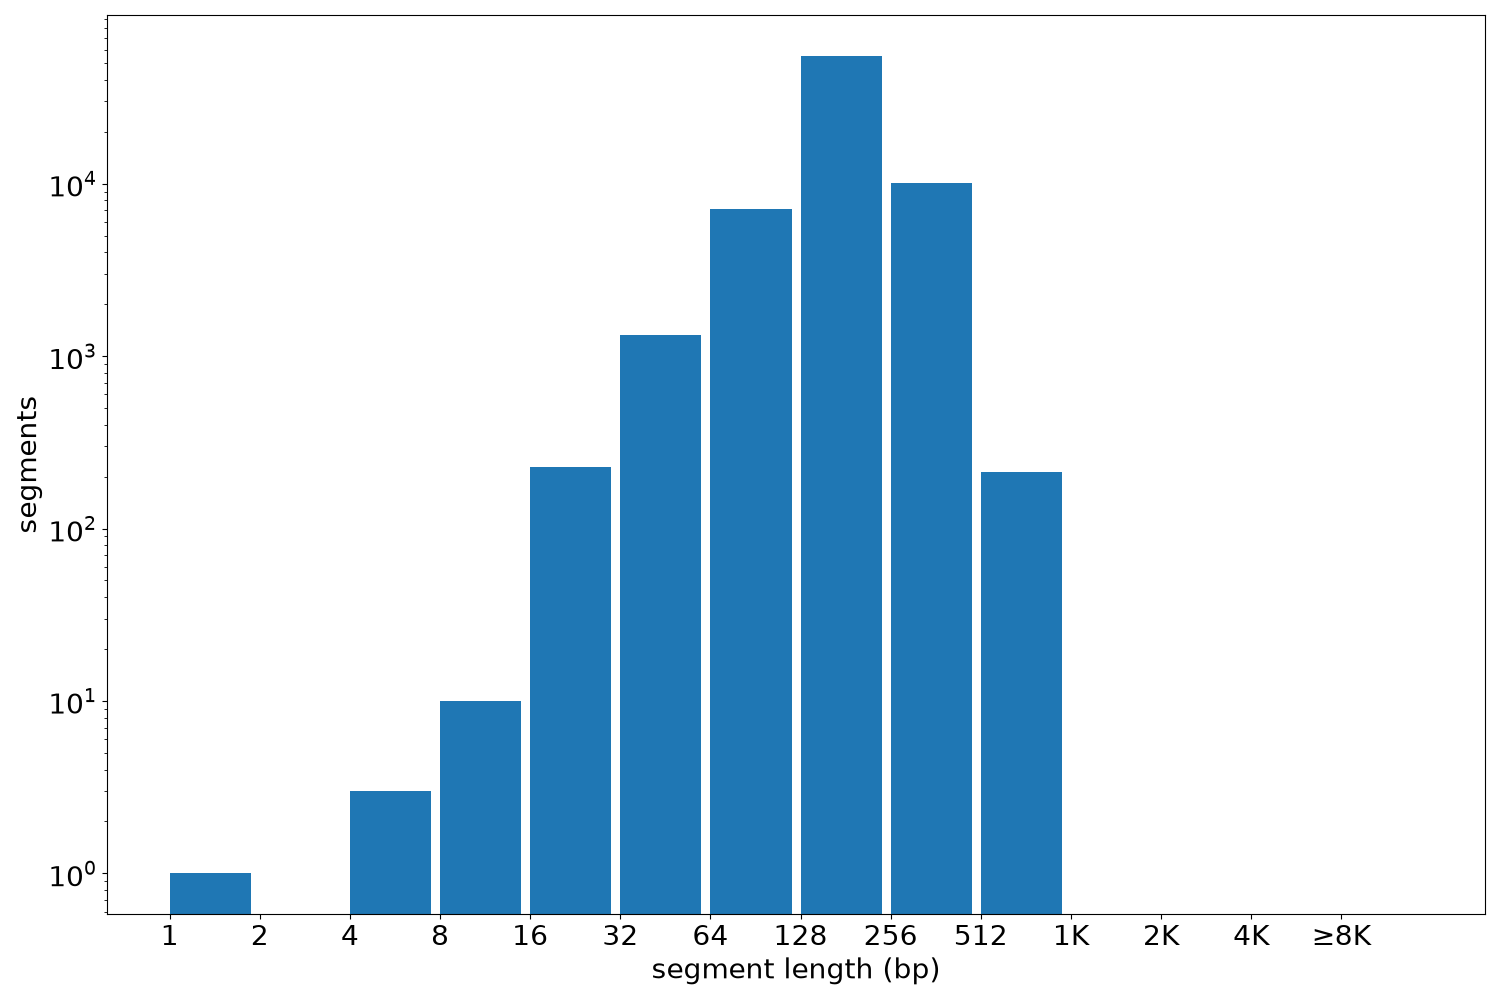
Segment lengths
| segments | min | max | mean | median | |
|---|---|---|---|---|---|
| segments | 74123 | 1 | 860 | 193.59 | 180 |
×
Files
| Filename | Size | md5 |
|---|---|---|
| ENCFF760FGA.bed.gz | 840.11 KB | c7e3f85e2367c4200d253e95f4290f1f |
| ENCFF760FGA.tabix.bed.gz | 766.44 KB | ad708365a20d394fa9aa3a966b1c2aaf |
| ENCFF760FGA.tabix.bed.gz.tbi | 284.24 KB | 2e31698b777d11b142544549477dd8d7 |
| genomic_resource.yaml | 1.77 KB | c54e5290a6d7843f513b4b1a9eec3d9b |
| statistics/ |