Resource
| Id | DNase-seq/ENCSR017SBI |
|---|---|
| Type | position_score |
| Version | 0 |
| Summary | DNase-seq ENCSR017SBI [biosample_summary="Homo sapiens with multiple sclerosis; naive B cell"] |
| Description |
status: released biological_replicates: Rep 1 summary: with multiple sclerosis output_type: peaks audit_warning: Signal Portion of Tags (SPOT) is a measure of enrichment, analogous to the commonly used fraction of reads in peaks metric. ENCODE processed alignment files {ENCFF052ZPU|/files/ENCFF052ZPU/} processed by DNase-seq ENCODE4 v3.0.0 GRCh38 pipeline ({ENCPL848KLD|/pipelines/ENCPL848KLD/}) for GRCh38 assembly have a SPOT1 score of 0.32. According to ENCODE standards, SPOT1 score of 0.4 or higher is considered a product of high quality data. Any sample with a SPOT1 score <0.3 should be targeted for replacement with a higher quality sample, and a SPOT1 score of 0.25 is considered minimally acceptable SPOT1 score of 0.25 is considered minimally acceptable for rare and hard to find primary tissues. (See {ENCODE DNase-seq data standards|/data-standards/dnase-seq-encode4/}) |
| Labels |
|
Scores (1)
| ID | Type | Default annotation | Description | Histogram | Range | Summary |
|---|---|---|---|---|---|---|
| DNase-seq_ENCSR017SBI | float |
DNase-seq_ENCSR017SBI |
DNase-seq ENCSR017SBI [biosample_summary="Homo sapiens with multiple sclerosis; naive B cell"]
|
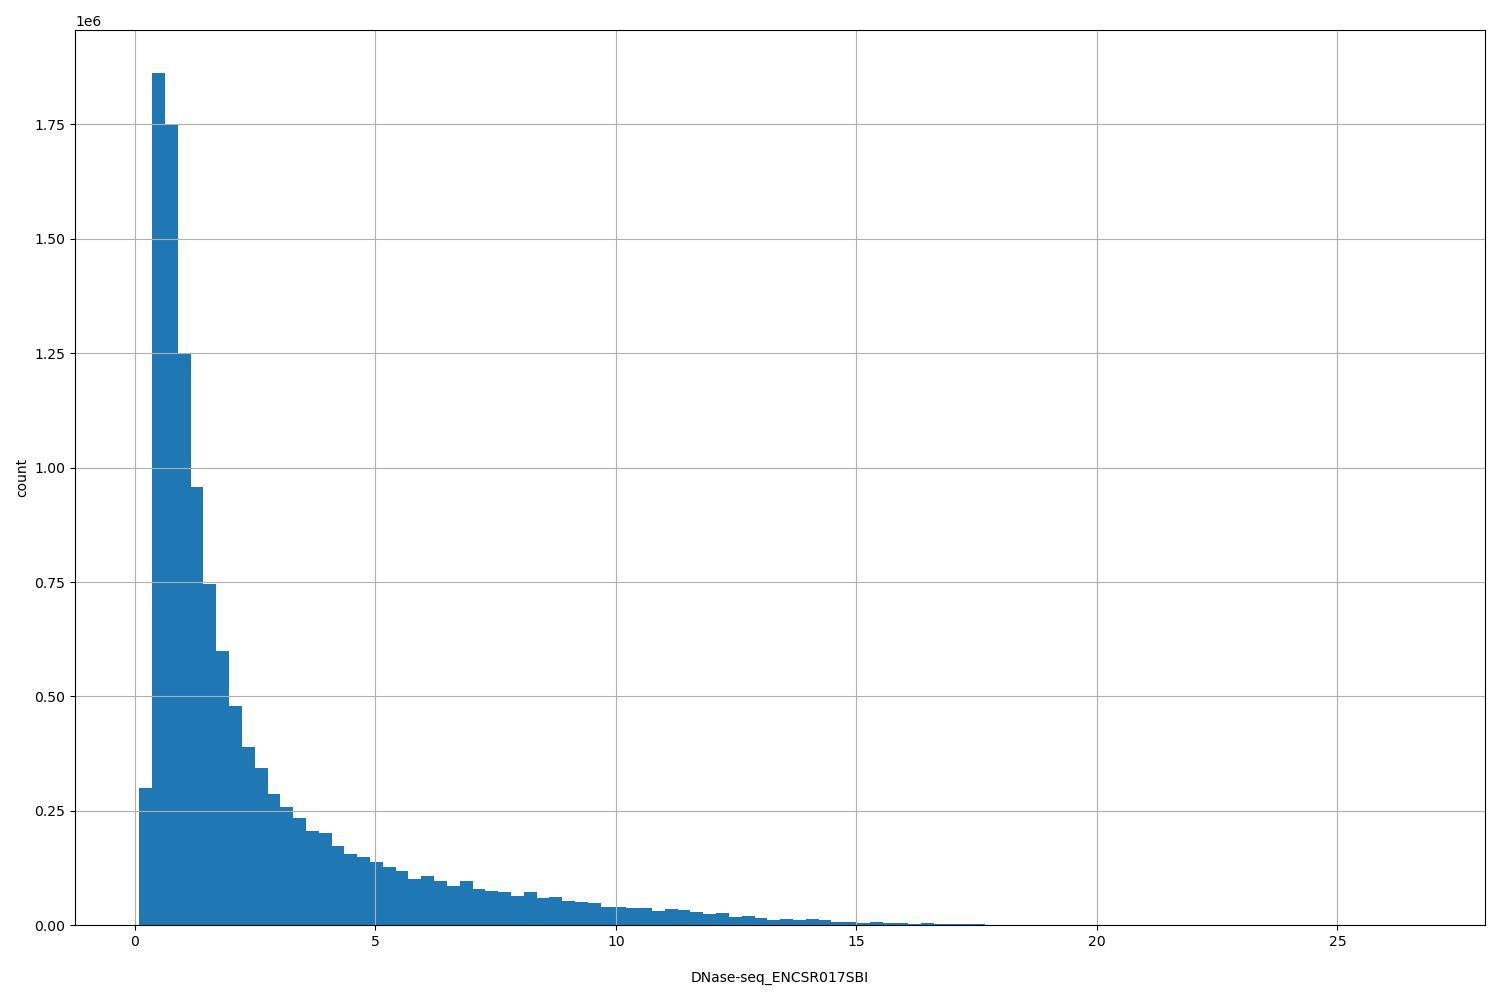 |
[0.0927, 26.7] |
|
n counts base pairs; sd is the population standard deviation.
Coverage
| Chromosome | Covered positions | Covered % | Segments |
|---|---|---|---|
| all chromosomes | 12370197 | 0.38% | 59308 |
| chr1 | 1180259 | 0.47% | 5622 |
| chr2 | 913763 | 0.38% | 4382 |
| chr3 | 724645 | 0.37% | 3508 |
| chr4 | 490506 | 0.26% | 2335 |
| chr5 | 606991 | 0.33% | 2856 |
| chr6 | 797430 | 0.47% | 3792 |
| chr7 | 596878 | 0.37% | 2879 |
| chr8 | 502516 | 0.35% | 2434 |
| chr9 | 497411 | 0.36% | 2412 |
| chr10 | 547030 | 0.41% | 2639 |
| chr11 | 622177 | 0.46% | 2973 |
| chr12 | 650350 | 0.49% | 3114 |
| chr13 | 260463 | 0.23% | 1277 |
| chr14 | 420160 | 0.39% | 2001 |
| chr15 | 391981 | 0.38% | 1907 |
| chr16 | 456853 | 0.51% | 2204 |
| chr17 | 682954 | 0.82% | 3224 |
| chr18 | 229403 | 0.29% | 1123 |
| chr19 | 684054 | 1.17% | 3190 |
| chr20 | 314324 | 0.49% | 1536 |
| chr21 | 147550 | 0.32% | 701 |
| chr22 | 285778 | 0.56% | 1385 |
| chrX | 352523 | 0.23% | 1744 |
| chrY | 14198 | 0.02% | 70 |
| 3342 contigs with no values (129077085 bp) | 0 | 0.00% | 0 |
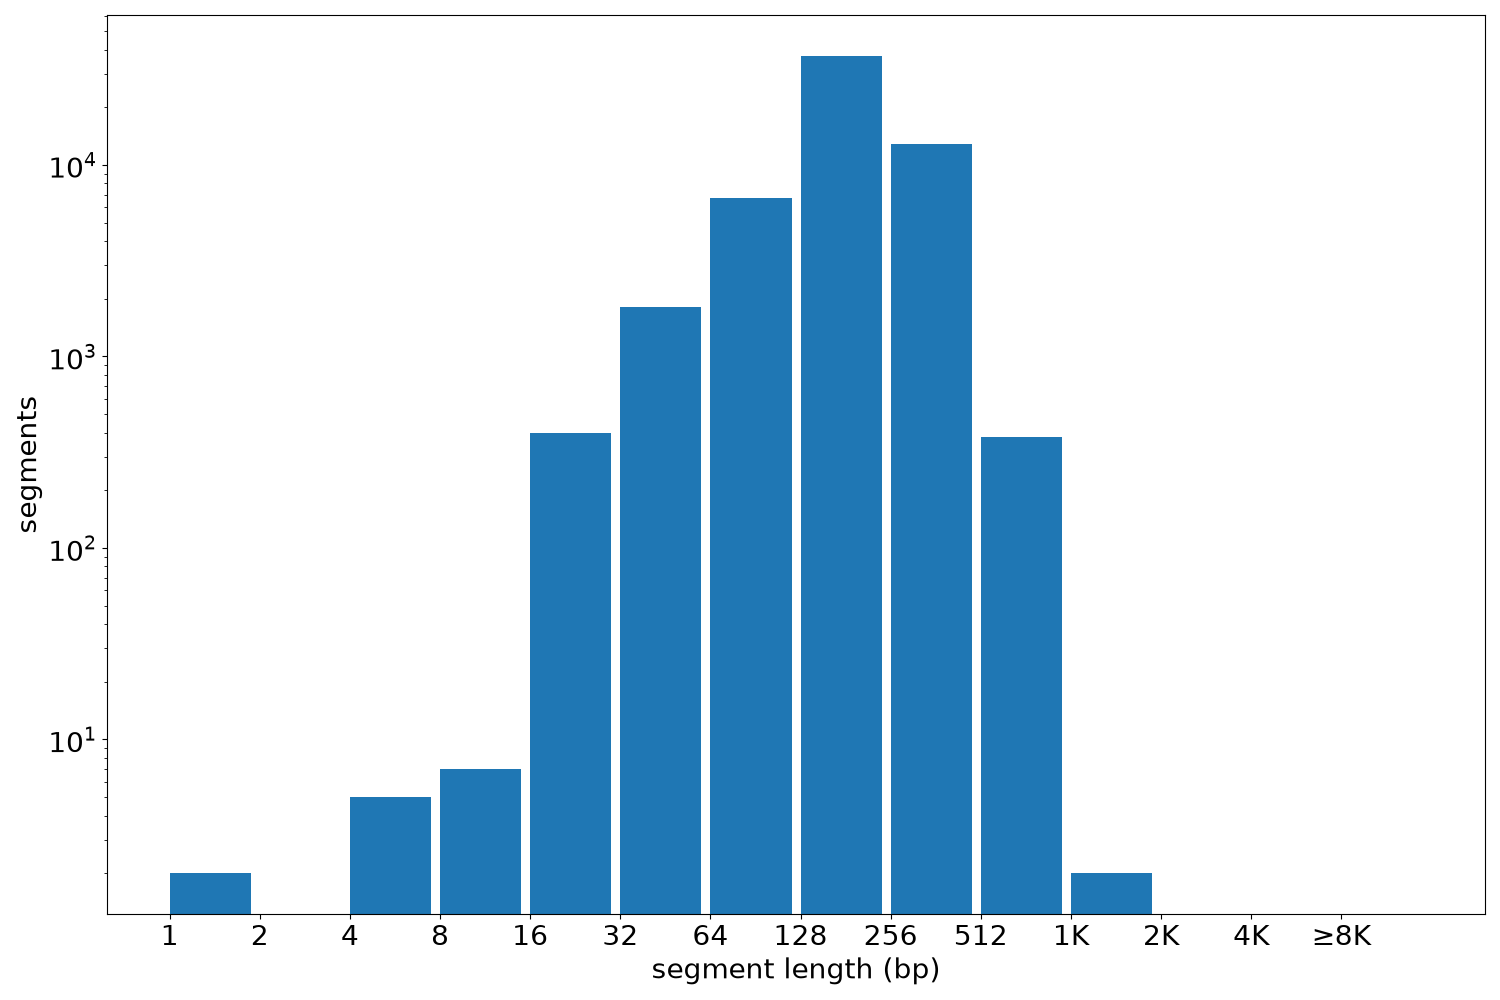
Segment lengths
| segments | min | max | mean | median | |
|---|---|---|---|---|---|
| segments | 59308 | 1 | 1280 | 208.58 | 200 |
Files
| Filename | Size | md5 |
|---|---|---|
| ENCFF660UHQ.bed.gz | 644.86 KB | e9195fe802a5cecdb073a9cf1abdaa79 |
| ENCFF660UHQ.tabix.bed.gz | 593.6 KB | 59ca7121101c11fc3b2adac6ca913585 |
| ENCFF660UHQ.tabix.bed.gz.tbi | 273.14 KB | 770f390e4d767cf687018ceacb8ac6ca |
| genomic_resource.yaml | 2.02 KB | 235d8b49c282904d07fcaf0710972b3f |
| statistics/ |