Resource
| Id | DNase-seq/ENCSR000ELB |
|---|---|
| Type | position_score |
| Version | 0 |
| Summary | DNase-seq ENCSR000ELB [biosample_summary="Homo sapiens D341Med"] |
| Description |
status: released biological_replicates: Rep 1 summary: output_type: peaks audit_internal_action: Released analysis {ENCAN531LEL|/analyses/ENCAN531LEL/} has in progress subobject document {bbde9024-8832-43b8-bef5-f817fc3e2441|/documents/bbde9024-8832-43b8-bef5-f817fc3e2441/} audit_warning: Signal Portion of Tags (SPOT) is a measure of enrichment, analogous to the commonly used fraction of reads in peaks metric. ENCODE processed alignment files {ENCFF282VWA|/files/ENCFF282VWA/} processed by DNase-seq ENCODE4 v3.0.0 GRCh38 pipeline ({ENCPL848KLD|/pipelines/ENCPL848KLD/}) for GRCh38 assembly have a SPOT1 score of 0.38. According to ENCODE standards, SPOT1 score of 0.4 or higher is considered a product of high quality data. Any sample with a SPOT1 score <0.3 should be targeted for replacement with a higher quality sample, and a SPOT1 score of 0.25 is considered minimally acceptable SPOT1 score of 0.25 is considered minimally acceptable for rare and hard to find primary tissues. (See {ENCODE DNase-seq data standards|/data-standards/dnase-seq-encode4/}) |
| Labels |
|
Scores (1)
| ID | Type | Default annotation | Description | Histogram | Range | Summary |
|---|---|---|---|---|---|---|
| DNase-seq_ENCSR000ELB | float |
DNase-seq_ENCSR000ELB |
DNase-seq ENCSR000ELB [biosample_summary="Homo sapiens D341Med"]
|
 |
[0.0302, 317] |
|
n counts base pairs; sd is the population standard deviation.
Coverage
| Chromosome | Covered positions | Covered % | Segments |
|---|---|---|---|
| all chromosomes | 25839551 | 0.80% | 135625 |
| chr1 | 2311571 | 0.93% | 12060 |
| chr2 | 1597173 | 0.66% | 8648 |
| chr3 | 1412487 | 0.71% | 7609 |
| chr4 | 1151250 | 0.61% | 6150 |
| chr5 | 1141882 | 0.63% | 6188 |
| chr6 | 1166493 | 0.68% | 6315 |
| chr7 | 1358311 | 0.85% | 7169 |
| chr8 | 1877653 | 1.29% | 9565 |
| chr9 | 1128987 | 0.82% | 5896 |
| chr10 | 996829 | 0.75% | 5303 |
| chr11 | 1322595 | 0.98% | 6861 |
| chr12 | 1124662 | 0.84% | 5973 |
| chr13 | 487804 | 0.43% | 2696 |
| chr14 | 855007 | 0.80% | 4438 |
| chr15 | 864524 | 0.85% | 4535 |
| chr16 | 791555 | 0.88% | 4190 |
| chr17 | 1707220 | 2.05% | 8560 |
| chr18 | 646046 | 0.80% | 3390 |
| chr19 | 1420221 | 2.42% | 7177 |
| chr20 | 748009 | 1.16% | 3820 |
| chr21 | 316845 | 0.68% | 1638 |
| chr22 | 772760 | 1.52% | 3999 |
| chrX | 622436 | 0.40% | 3350 |
| chrY | 17231 | 0.03% | 95 |
| 3342 contigs with no values (129077085 bp) | 0 | 0.00% | 0 |
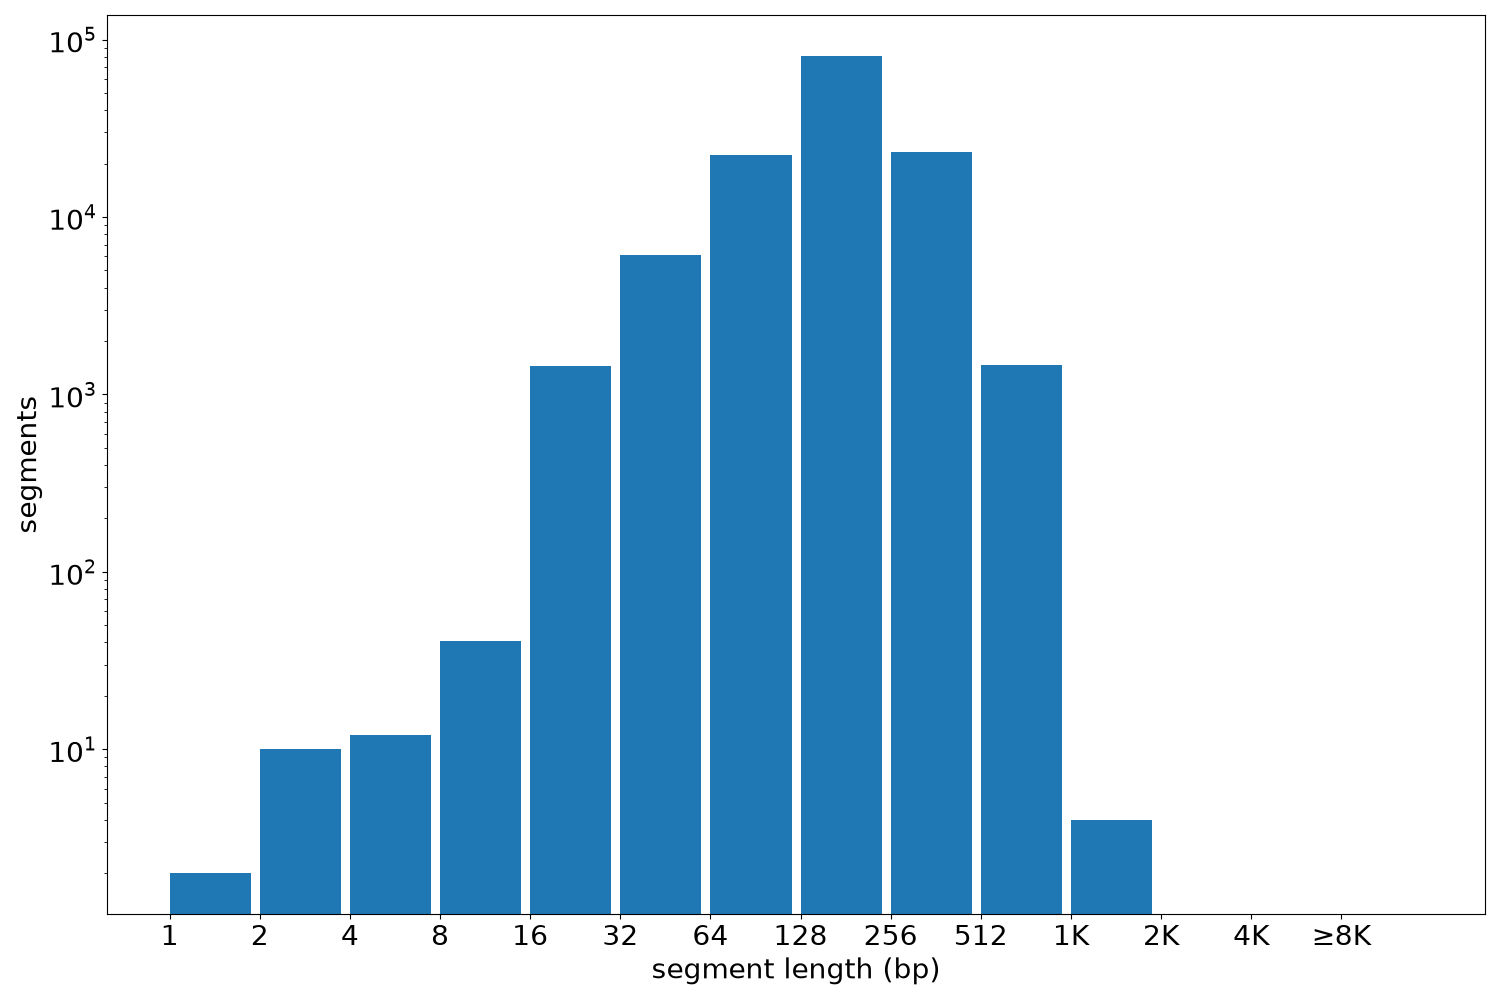
Segment lengths
| segments | min | max | mean | median | |
|---|---|---|---|---|---|
| segments | 135625 | 1 | 1136 | 190.52 | 180 |
Files
| Filename | Size | md5 |
|---|---|---|
| ENCFF677CTE.bed.gz | 1.43 MB | cb3316318c53bf100e7d1dcc8a6a96f0 |
| ENCFF677CTE.tabix.bed.gz | 1.32 MB | ef319714586807c8912614eaf517db3c |
| ENCFF677CTE.tabix.bed.gz.tbi | 429.72 KB | aceed1d48a93885e4a5624f25a540482 |
| genomic_resource.yaml | 2.13 KB | 961afc8802f33f365287f7194e368b07 |
| statistics/ |