Resource
| Id | DNase-seq/ENCSR000EKS |
|---|---|
| Type | position_score |
| Version | 0 |
| Summary | DNase-seq ENCSR000EKS [biosample_summary="Homo sapiens K562"] |
| Description |
status: released biological_replicates: Rep 1 summary: output_type: peaks audit_internal_action: Released analysis {ENCAN694OCK|/analyses/ENCAN694OCK/} has in progress subobject document {9674d4ce-4abb-49b5-b6b3-1eca5d0ac16f|/documents/9674d4ce-4abb-49b5-b6b3-1eca5d0ac16f/} audit_warning: Signal Portion of Tags (SPOT) is a measure of enrichment, analogous to the commonly used fraction of reads in peaks metric. ENCODE processed alignment files {ENCFF257HEE|/files/ENCFF257HEE/} processed by DNase-seq ENCODE4 v3.0.0 GRCh38 pipeline ({ENCPL848KLD|/pipelines/ENCPL848KLD/}) for GRCh38 assembly have a SPOT1 score of 0.32. According to ENCODE standards, SPOT1 score of 0.4 or higher is considered a product of high quality data. Any sample with a SPOT1 score <0.3 should be targeted for replacement with a higher quality sample, and a SPOT1 score of 0.25 is considered minimally acceptable SPOT1 score of 0.25 is considered minimally acceptable for rare and hard to find primary tissues. (See {ENCODE DNase-seq data standards|/data-standards/dnase-seq-encode4/}) |
| Labels |
|
Scores (1)
| ID | Type | Default annotation | Description | Histogram | Range | Summary |
|---|---|---|---|---|---|---|
| DNase-seq_ENCSR000EKS | float |
DNase-seq_ENCSR000EKS |
DNase-seq ENCSR000EKS [biosample_summary="Homo sapiens K562"]
|
 |
[0.0253, 65.3] |
|
n counts base pairs; sd is the population standard deviation.
Coverage
| Chromosome | Covered positions | Covered % | Segments |
|---|---|---|---|
| all chromosomes | 21259284 | 0.66% | 119206 |
| chr1 | 2239230 | 0.90% | 12450 |
| chr2 | 1476807 | 0.61% | 8464 |
| chr3 | 1251551 | 0.63% | 7123 |
| chr4 | 785372 | 0.41% | 4495 |
| chr5 | 1005336 | 0.55% | 5692 |
| chr6 | 1263477 | 0.74% | 7085 |
| chr7 | 1149137 | 0.72% | 6466 |
| chr8 | 826042 | 0.57% | 4712 |
| chr9 | 877304 | 0.63% | 4867 |
| chr10 | 983139 | 0.73% | 5507 |
| chr11 | 1146466 | 0.85% | 6357 |
| chr12 | 1054892 | 0.79% | 5923 |
| chr13 | 444648 | 0.39% | 2441 |
| chr14 | 602112 | 0.56% | 3411 |
| chr15 | 661187 | 0.65% | 3722 |
| chr16 | 818114 | 0.91% | 4511 |
| chr17 | 1076443 | 1.29% | 5980 |
| chr18 | 352247 | 0.44% | 2038 |
| chr19 | 1177937 | 2.01% | 6382 |
| chr20 | 598259 | 0.93% | 3380 |
| chr21 | 221642 | 0.47% | 1247 |
| chr22 | 618321 | 1.22% | 3386 |
| chrX | 629145 | 0.40% | 3563 |
| chrY | 476 | <0.01% | 4 |
| 3342 contigs with no values (129077085 bp) | 0 | 0.00% | 0 |
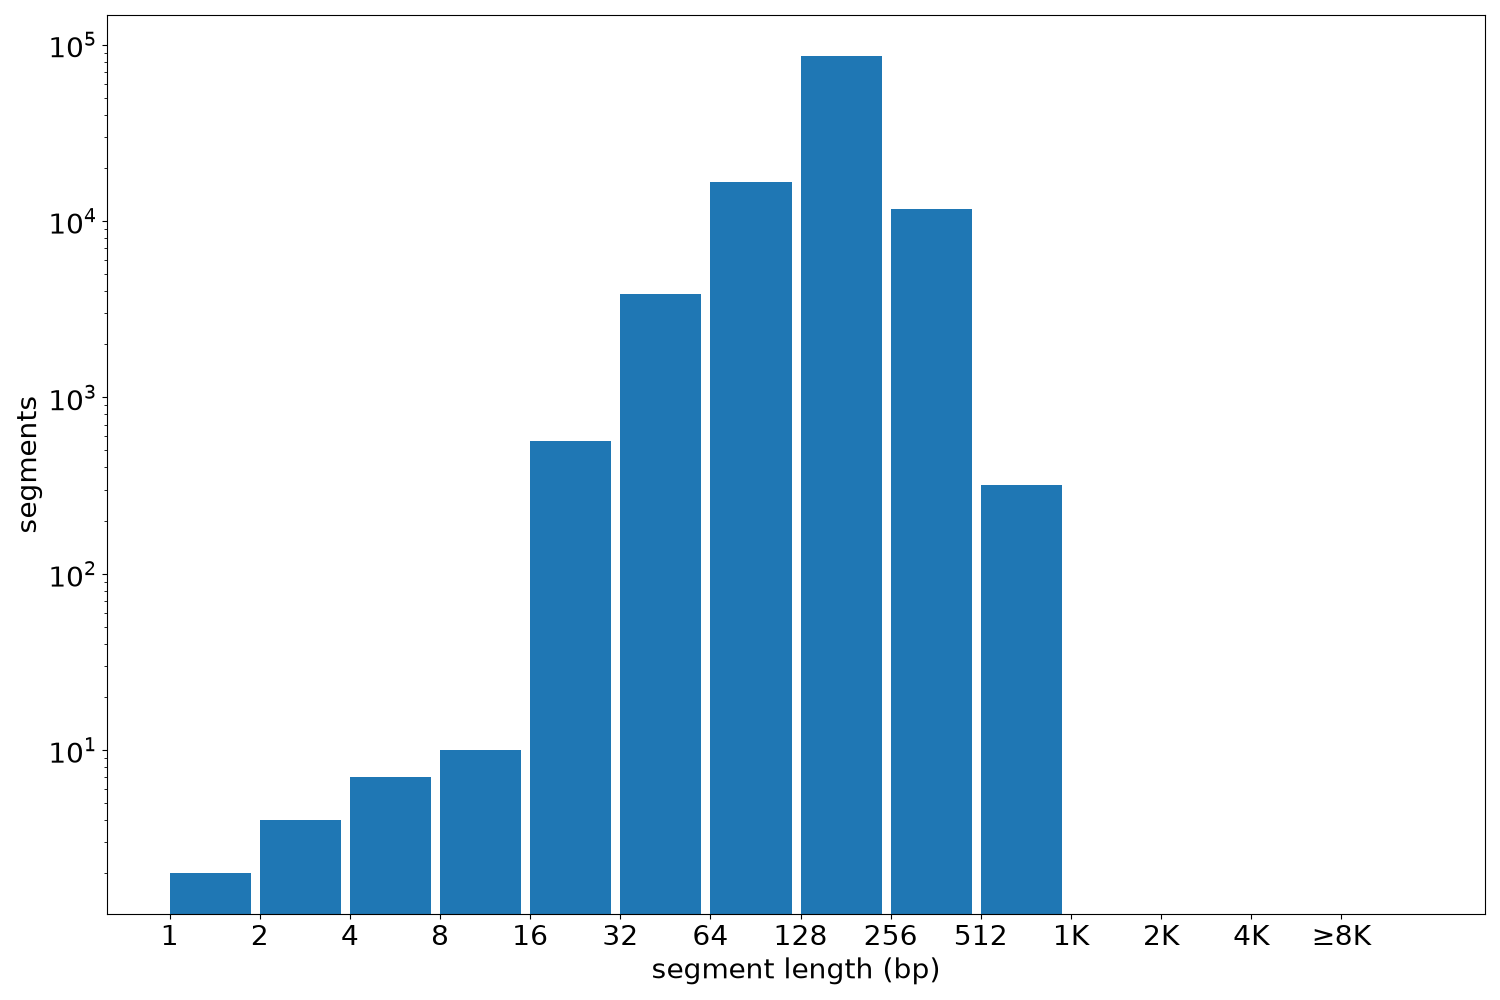
Segment lengths
| segments | min | max | mean | median | |
|---|---|---|---|---|---|
| segments | 119206 | 1 | 960 | 178.34 | 180 |
Files
| Filename | Size | md5 |
|---|---|---|
| ENCFF274YGF.bed.gz | 1.29 MB | 9262ab2b89cd60d05deb831cdd6b509e |
| ENCFF274YGF.tabix.bed.gz | 1.19 MB | 56911d0373b6f5a308b5f9c0af874f16 |
| ENCFF274YGF.tabix.bed.gz.tbi | 424.63 KB | c769521b0ce76bd43224ed1f73a90498 |
| genomic_resource.yaml | 2.12 KB | 1cdd37182404aa71216eaf0e61b0262c |
| statistics/ |