Resource
| Id | DNase-seq/ENCSR000EKK |
|---|---|
| Type | position_score |
| Version | 0 |
| Summary | DNase-seq ENCSR000EKK [biosample_summary="Homo sapiens iPS-NIHi7 originated from AG08395"] |
| Description |
status: released biological_replicates: Rep 1 summary: output_type: peaks audit_error: Signal Portion of Tags (SPOT) is a measure of enrichment, analogous to the commonly used fraction of reads in peaks metric. ENCODE processed alignment files {ENCFF710NCT|/files/ENCFF710NCT/} processed by DNase-seq ENCODE4 v3.0.0 GRCh38 pipeline ({ENCPL848KLD|/pipelines/ENCPL848KLD/}) for GRCh38 assembly have a SPOT1 score of 0.24. According to ENCODE standards, SPOT1 score of 0.4 or higher is considered a product of high quality data. Any sample with a SPOT1 score <0.3 should be targeted for replacement with a higher quality sample, and a SPOT1 score of 0.25 is considered minimally acceptable SPOT1 score of 0.25 is considered minimally acceptable for rare and hard to find primary tissues. (See {ENCODE DNase-seq data standards|/data-standards/dnase-seq-encode4/}) audit_internal_action: Released analysis {ENCAN893ALP|/analyses/ENCAN893ALP/} has in progress subobject document {97e02c3b-82d2-4e29-bb5a-2ed27482f885|/documents/97e02c3b-82d2-4e29-bb5a-2ed27482f885/} |
| Labels |
|
Scores (1)
| ID | Type | Default annotation | Description | Histogram | Range | Summary |
|---|---|---|---|---|---|---|
| DNase-seq_ENCSR000EKK | float |
DNase-seq_ENCSR000EKK |
DNase-seq ENCSR000EKK [biosample_summary="Homo sapiens iPS-NIHi7 originated from AG08395"]
|
 |
[0.0302, 5.87] |
|
n counts base pairs; sd is the population standard deviation.
Coverage
| Chromosome | Covered positions | Covered % | Segments |
|---|---|---|---|
| all chromosomes | 25902926 | 0.81% | 140467 |
| chr1 | 2439884 | 0.98% | 12935 |
| chr2 | 2022286 | 0.83% | 11183 |
| chr3 | 1555404 | 0.78% | 8568 |
| chr4 | 1177922 | 0.62% | 6491 |
| chr5 | 1367952 | 0.75% | 7500 |
| chr6 | 1400816 | 0.82% | 7704 |
| chr7 | 1268831 | 0.80% | 6943 |
| chr8 | 1133425 | 0.78% | 6246 |
| chr9 | 1108890 | 0.80% | 5995 |
| chr10 | 1250789 | 0.93% | 6839 |
| chr11 | 1414303 | 1.05% | 7603 |
| chr12 | 1253338 | 0.94% | 6757 |
| chr13 | 617092 | 0.54% | 3479 |
| chr14 | 803906 | 0.75% | 4350 |
| chr15 | 827058 | 0.81% | 4470 |
| chr16 | 903789 | 1.00% | 4803 |
| chr17 | 1199492 | 1.44% | 6332 |
| chr18 | 542840 | 0.68% | 3032 |
| chr19 | 1160522 | 1.98% | 5872 |
| chr20 | 717930 | 1.11% | 3859 |
| chr21 | 272589 | 0.58% | 1476 |
| chr22 | 559651 | 1.10% | 3037 |
| chrX | 903259 | 0.58% | 4983 |
| chrY | 958 | <0.01% | 10 |
| 3342 contigs with no values (129077085 bp) | 0 | 0.00% | 0 |
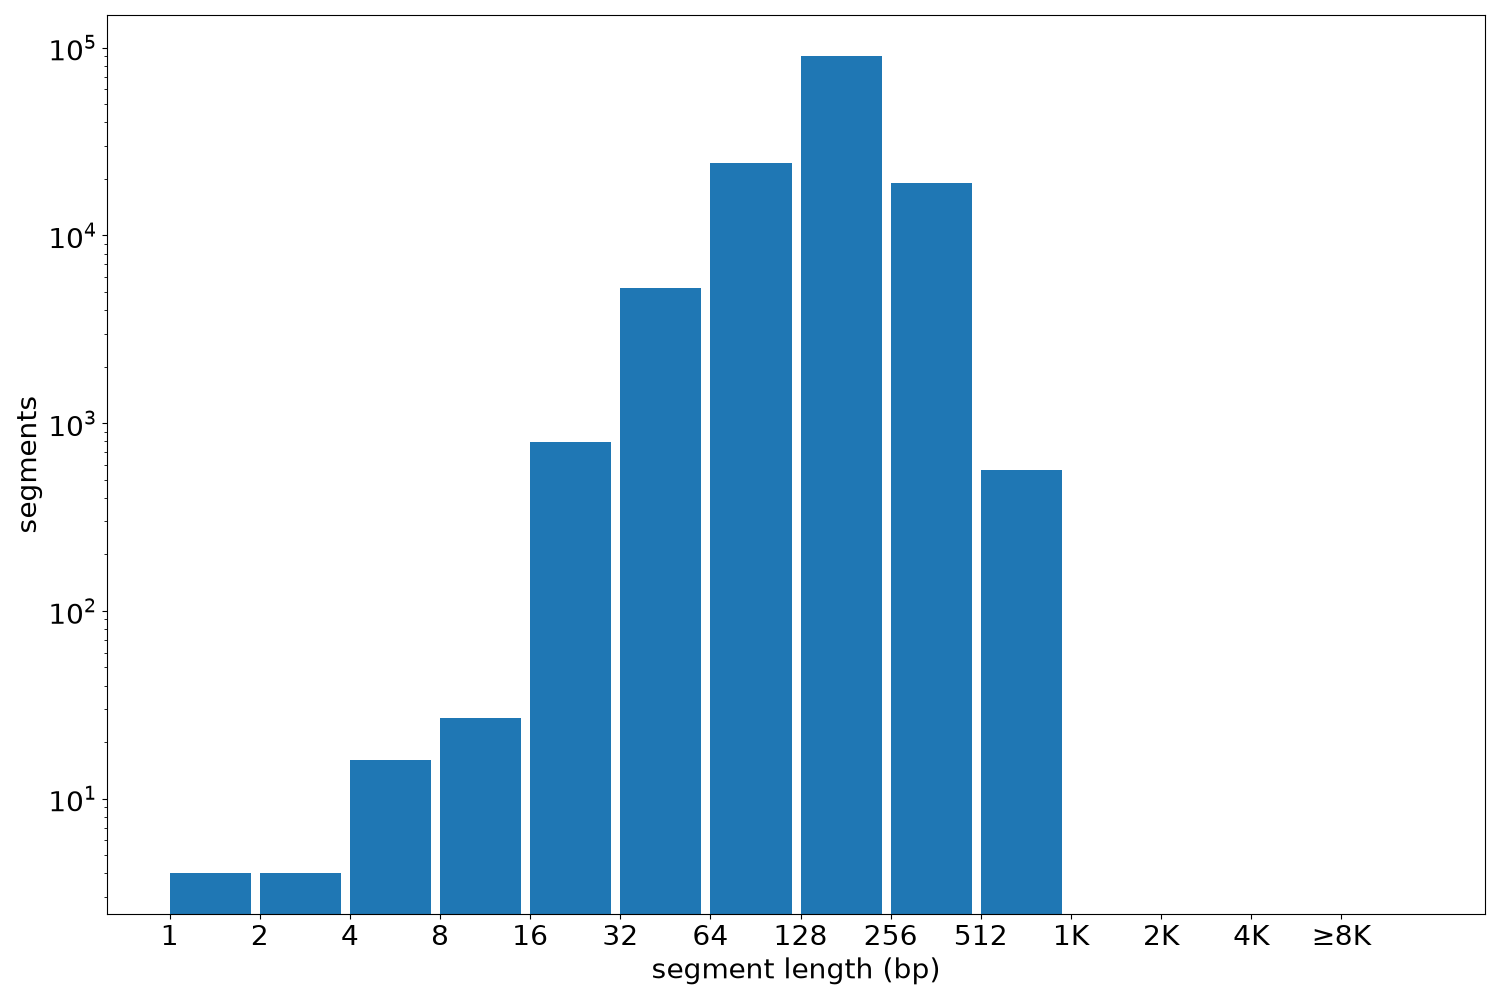
Segment lengths
| segments | min | max | mean | median | |
|---|---|---|---|---|---|
| segments | 140467 | 1 | 940 | 184.41 | 180 |
Files
| Filename | Size | md5 |
|---|---|---|
| ENCFF532ILC.bed.gz | 1.5 MB | 856ab715750552234f62f35fdbd2090c |
| ENCFF532ILC.tabix.bed.gz | 1.37 MB | 2477b54ceb0a3e660c7b63ffdd4332cf |
| ENCFF532ILC.tabix.bed.gz.tbi | 525.48 KB | 5e799692f7253f96b9ca4458abdcdbf1 |
| genomic_resource.yaml | 2.21 KB | 923ee91d092167f6e056554e02baab6b |
| statistics/ |