Resource
| Id | DNase-seq/ENCSR000EKJ |
|---|---|
| Type | position_score |
| Version | 0 |
| Summary | DNase-seq ENCSR000EKJ [biosample_summary="Homo sapiens iPS-NIHi11 originated from AG20443"] |
| Description |
status: released biological_replicates: Rep 1 summary: output_type: peaks audit_internal_action: Released analysis {ENCAN508JOC|/analyses/ENCAN508JOC/} has in progress subobject document {0a338124-2b59-47bd-ab4c-3cc296efad34|/documents/0a338124-2b59-47bd-ab4c-3cc296efad34/} audit_warning: Signal Portion of Tags (SPOT) is a measure of enrichment, analogous to the commonly used fraction of reads in peaks metric. ENCODE processed alignment files {ENCFF012FPM|/files/ENCFF012FPM/} processed by DNase-seq ENCODE4 v3.0.0 GRCh38 pipeline ({ENCPL848KLD|/pipelines/ENCPL848KLD/}) for GRCh38 assembly have a SPOT1 score of 0.31. According to ENCODE standards, SPOT1 score of 0.4 or higher is considered a product of high quality data. Any sample with a SPOT1 score <0.3 should be targeted for replacement with a higher quality sample, and a SPOT1 score of 0.25 is considered minimally acceptable SPOT1 score of 0.25 is considered minimally acceptable for rare and hard to find primary tissues. (See {ENCODE DNase-seq data standards|/data-standards/dnase-seq-encode4/}) |
| Labels |
|
Scores (1)
| ID | Type | Default annotation | Description | Histogram | Range | Summary |
|---|---|---|---|---|---|---|
| DNase-seq_ENCSR000EKJ | float |
DNase-seq_ENCSR000EKJ |
DNase-seq ENCSR000EKJ [biosample_summary="Homo sapiens iPS-NIHi11 originated from AG20443"]
|
 |
[0.0335, 12.6] |
|
n counts base pairs; sd is the population standard deviation.
Coverage
| Chromosome | Covered positions | Covered % | Segments |
|---|---|---|---|
| all chromosomes | 25976726 | 0.81% | 140391 |
| chr1 | 2395480 | 0.96% | 12784 |
| chr2 | 1919723 | 0.79% | 10539 |
| chr3 | 1523982 | 0.77% | 8396 |
| chr4 | 1227581 | 0.65% | 6830 |
| chr5 | 1328505 | 0.73% | 7297 |
| chr6 | 1408083 | 0.82% | 7705 |
| chr7 | 1354125 | 0.85% | 7305 |
| chr8 | 1080827 | 0.74% | 5954 |
| chr9 | 1109861 | 0.80% | 6000 |
| chr10 | 1225681 | 0.92% | 6699 |
| chr11 | 1405319 | 1.04% | 7533 |
| chr12 | 1264462 | 0.95% | 6759 |
| chr13 | 590738 | 0.52% | 3328 |
| chr14 | 834260 | 0.78% | 4470 |
| chr15 | 821476 | 0.81% | 4373 |
| chr16 | 953158 | 1.06% | 5051 |
| chr17 | 1270821 | 1.53% | 6658 |
| chr18 | 534095 | 0.66% | 2944 |
| chr19 | 1346073 | 2.30% | 6813 |
| chr20 | 727147 | 1.13% | 3952 |
| chr21 | 293158 | 0.63% | 1600 |
| chr22 | 604158 | 1.19% | 3182 |
| chrX | 732226 | 0.47% | 4069 |
| chrY | 25787 | 0.05% | 150 |
| 3342 contigs with no values (129077085 bp) | 0 | 0.00% | 0 |
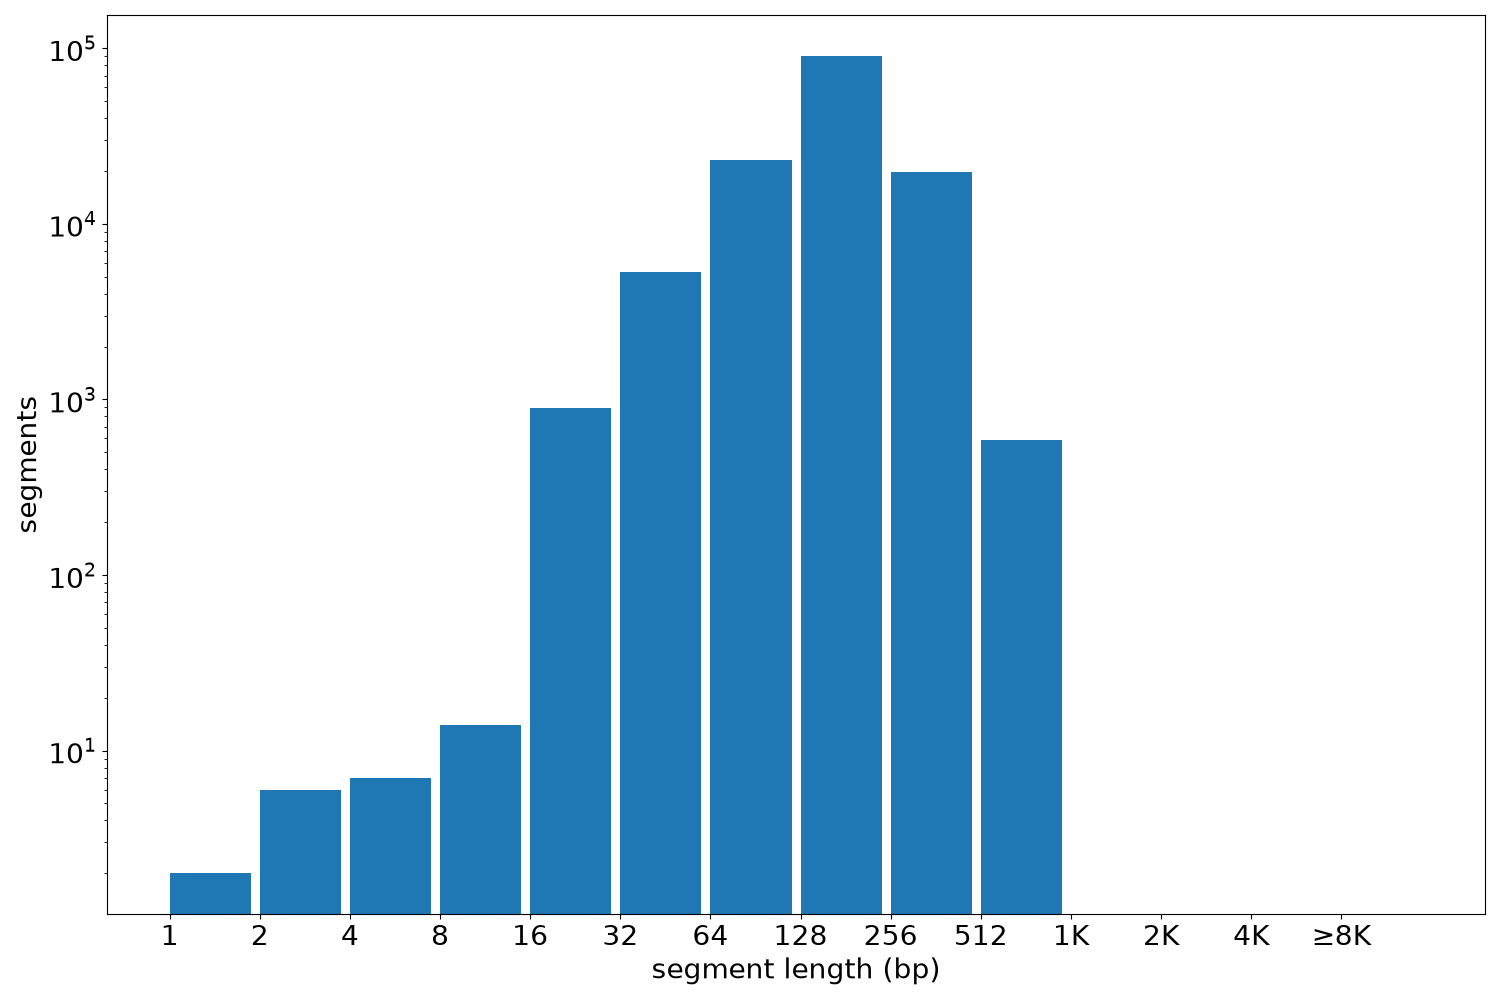
Segment lengths
| segments | min | max | mean | median | |
|---|---|---|---|---|---|
| segments | 140391 | 1 | 1000 | 185.03 | 180 |
Files
| Filename | Size | md5 |
|---|---|---|
| ENCFF669SYE.bed.gz | 1.5 MB | 9096b34cacfd692d5ae243bfefa5803d |
| ENCFF669SYE.tabix.bed.gz | 1.37 MB | f4dc8fd961f4819ae76858ddb924c084 |
| ENCFF669SYE.tabix.bed.gz.tbi | 519.78 KB | af810951f59f3fbeb95271d107e71d52 |
| genomic_resource.yaml | 2.21 KB | 64ee9f4267b4ee2098172251f1c54ef9 |
| statistics/ |