Resource
| Id | DNase-seq/ENCSR000EJR |
|---|---|
| Type | position_score |
| Version | 0 |
| Summary | DNase-seq ENCSR000EJR [biosample_summary="Homo sapiens HEK293T"] |
| Description |
status: released biological_replicates: Rep 1 summary: output_type: peaks audit_error: Signal Portion of Tags (SPOT) is a measure of enrichment, analogous to the commonly used fraction of reads in peaks metric. ENCODE processed alignment files {ENCFF969MBJ|/files/ENCFF969MBJ/} processed by DNase-seq ENCODE4 v3.0.0 GRCh38 pipeline ({ENCPL848KLD|/pipelines/ENCPL848KLD/}) for GRCh38 assembly have a SPOT1 score of 0.23. According to ENCODE standards, SPOT1 score of 0.4 or higher is considered a product of high quality data. Any sample with a SPOT1 score <0.3 should be targeted for replacement with a higher quality sample, and a SPOT1 score of 0.25 is considered minimally acceptable SPOT1 score of 0.25 is considered minimally acceptable for rare and hard to find primary tissues. (See {ENCODE DNase-seq data standards|/data-standards/dnase-seq-encode4/}) audit_internal_action: Released analysis {ENCAN737CVW|/analyses/ENCAN737CVW/} has in progress subobject document {c041c2b5-8aa3-4add-a439-01c3ce241055|/documents/c041c2b5-8aa3-4add-a439-01c3ce241055/} |
| Labels |
|
Scores (1)
| ID | Type | Default annotation | Description | Histogram | Range | Summary |
|---|---|---|---|---|---|---|
| DNase-seq_ENCSR000EJR | float |
DNase-seq_ENCSR000EJR |
DNase-seq ENCSR000EJR [biosample_summary="Homo sapiens HEK293T"]
|
 |
[0.0347, 11] |
|
n counts base pairs; sd is the population standard deviation.
Coverage
| Chromosome | Covered positions | Covered % | Segments |
|---|---|---|---|
| all chromosomes | 16182597 | 0.50% | 86196 |
| chr1 | 1686141 | 0.68% | 8807 |
| chr2 | 1155483 | 0.48% | 6242 |
| chr3 | 971935 | 0.49% | 5185 |
| chr4 | 770311 | 0.40% | 4145 |
| chr5 | 816133 | 0.45% | 4398 |
| chr6 | 963344 | 0.56% | 5078 |
| chr7 | 818031 | 0.51% | 4385 |
| chr8 | 665099 | 0.46% | 3623 |
| chr9 | 676306 | 0.49% | 3581 |
| chr10 | 783066 | 0.59% | 4226 |
| chr11 | 806485 | 0.60% | 4280 |
| chr12 | 804045 | 0.60% | 4299 |
| chr13 | 397960 | 0.35% | 2170 |
| chr14 | 525471 | 0.49% | 2766 |
| chr15 | 513831 | 0.50% | 2703 |
| chr16 | 545164 | 0.60% | 2888 |
| chr17 | 773573 | 0.93% | 4056 |
| chr18 | 312814 | 0.39% | 1697 |
| chr19 | 735714 | 1.26% | 3825 |
| chr20 | 416323 | 0.65% | 2243 |
| chr21 | 153425 | 0.33% | 823 |
| chr22 | 346483 | 0.68% | 1825 |
| chrX | 545460 | 0.35% | 2951 |
| 3343 contigs with no values (186304500 bp) | 0 | 0.00% | 0 |
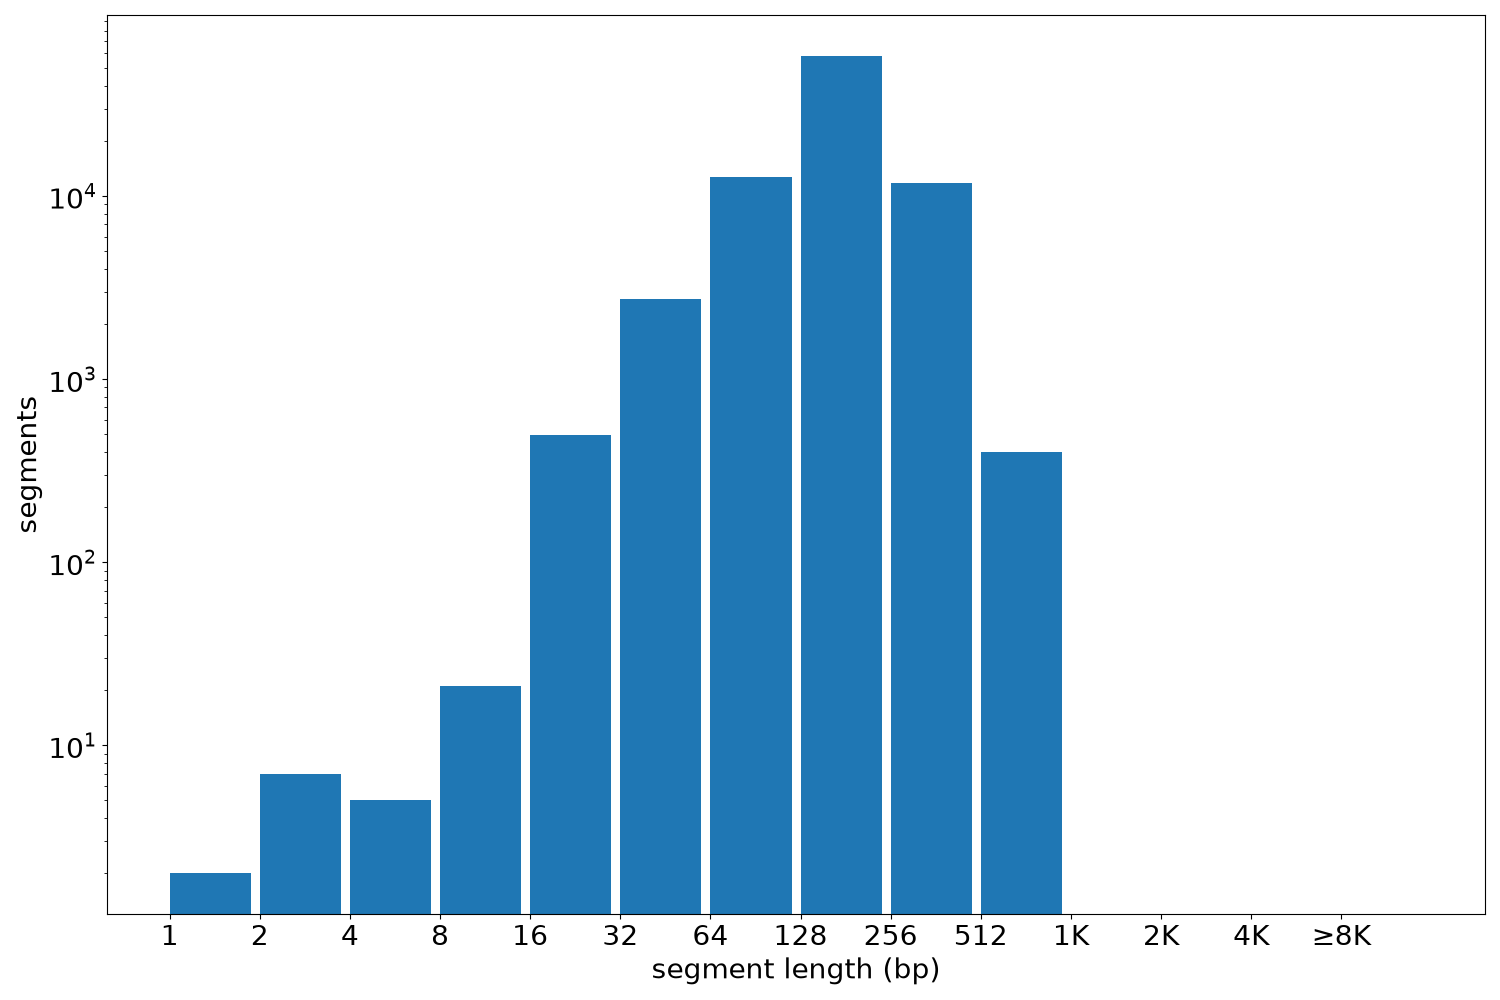
Segment lengths
| segments | min | max | mean | median | |
|---|---|---|---|---|---|
| segments | 86196 | 1 | 920 | 187.74 | 180 |
Files
| Filename | Size | md5 |
|---|---|---|
| ENCFF285OXK.bed.gz | 929.49 KB | e6b62f6119f80acae548c7403f5f5176 |
| ENCFF285OXK.tabix.bed.gz | 861.36 KB | f09c9b12c3334d392e056ff54f9e2aa5 |
| ENCFF285OXK.tabix.bed.gz.tbi | 376.86 KB | be9d35f7eccaad3b0ffc930f746c6b51 |
| genomic_resource.yaml | 2.13 KB | 3262a11cb366d9a8f3ba44fd8567acf3 |
| statistics/ |