Resource
| Id | DNase-seq/ENCSR000EJH |
|---|---|
| Type | position_score |
| Version | 0 |
| Summary | DNase-seq ENCSR000EJH [biosample_summary="Homo sapiens GM13977"] |
| Description |
status: released biological_replicates: Rep 1 summary: output_type: peaks audit_internal_action: Released analysis {ENCAN986TJO|/analyses/ENCAN986TJO/} has in progress subobject document {350deab8-64ea-480b-90a6-127fabfd325f|/documents/350deab8-64ea-480b-90a6-127fabfd325f/} audit_warning: Signal Portion of Tags (SPOT) is a measure of enrichment, analogous to the commonly used fraction of reads in peaks metric. ENCODE processed alignment files {ENCFF965BFK|/files/ENCFF965BFK/} processed by DNase-seq ENCODE4 v3.0.0 GRCh38 pipeline ({ENCPL848KLD|/pipelines/ENCPL848KLD/}) for GRCh38 assembly have a SPOT1 score of 0.30. According to ENCODE standards, SPOT1 score of 0.4 or higher is considered a product of high quality data. Any sample with a SPOT1 score <0.3 should be targeted for replacement with a higher quality sample, and a SPOT1 score of 0.25 is considered minimally acceptable SPOT1 score of 0.25 is considered minimally acceptable for rare and hard to find primary tissues. (See {ENCODE DNase-seq data standards|/data-standards/dnase-seq-encode4/}) |
| Labels |
|
Scores (1)
| ID | Type | Default annotation | Description | Histogram | Range | Summary |
|---|---|---|---|---|---|---|
| DNase-seq_ENCSR000EJH | float |
DNase-seq_ENCSR000EJH |
DNase-seq ENCSR000EJH [biosample_summary="Homo sapiens GM13977"]
|
 |
[0.0173, 17.9] |
|
n counts base pairs; sd is the population standard deviation.
Coverage
| Chromosome | Covered positions | Covered % | Segments |
|---|---|---|---|
| all chromosomes | 20680728 | 0.64% | 107522 |
| chr1 | 1958496 | 0.79% | 10041 |
| chr2 | 1584540 | 0.65% | 8241 |
| chr3 | 1167044 | 0.59% | 6215 |
| chr4 | 894432 | 0.47% | 4650 |
| chr5 | 1014787 | 0.56% | 5312 |
| chr6 | 1174314 | 0.69% | 6092 |
| chr7 | 1017747 | 0.64% | 5315 |
| chr8 | 915269 | 0.63% | 4770 |
| chr9 | 861369 | 0.62% | 4515 |
| chr10 | 958784 | 0.72% | 4994 |
| chr11 | 1123964 | 0.83% | 5766 |
| chr12 | 1038643 | 0.78% | 5420 |
| chr13 | 440180 | 0.38% | 2327 |
| chr14 | 713815 | 0.67% | 3688 |
| chr15 | 697398 | 0.68% | 3633 |
| chr16 | 741755 | 0.82% | 3841 |
| chr17 | 1083705 | 1.30% | 5554 |
| chr18 | 392541 | 0.49% | 2065 |
| chr19 | 1110597 | 1.89% | 5674 |
| chr20 | 558624 | 0.87% | 2919 |
| chr21 | 219103 | 0.47% | 1143 |
| chr22 | 474881 | 0.93% | 2481 |
| chrX | 538009 | 0.34% | 2859 |
| chrY | 731 | <0.01% | 7 |
| 3342 contigs with no values (129077085 bp) | 0 | 0.00% | 0 |
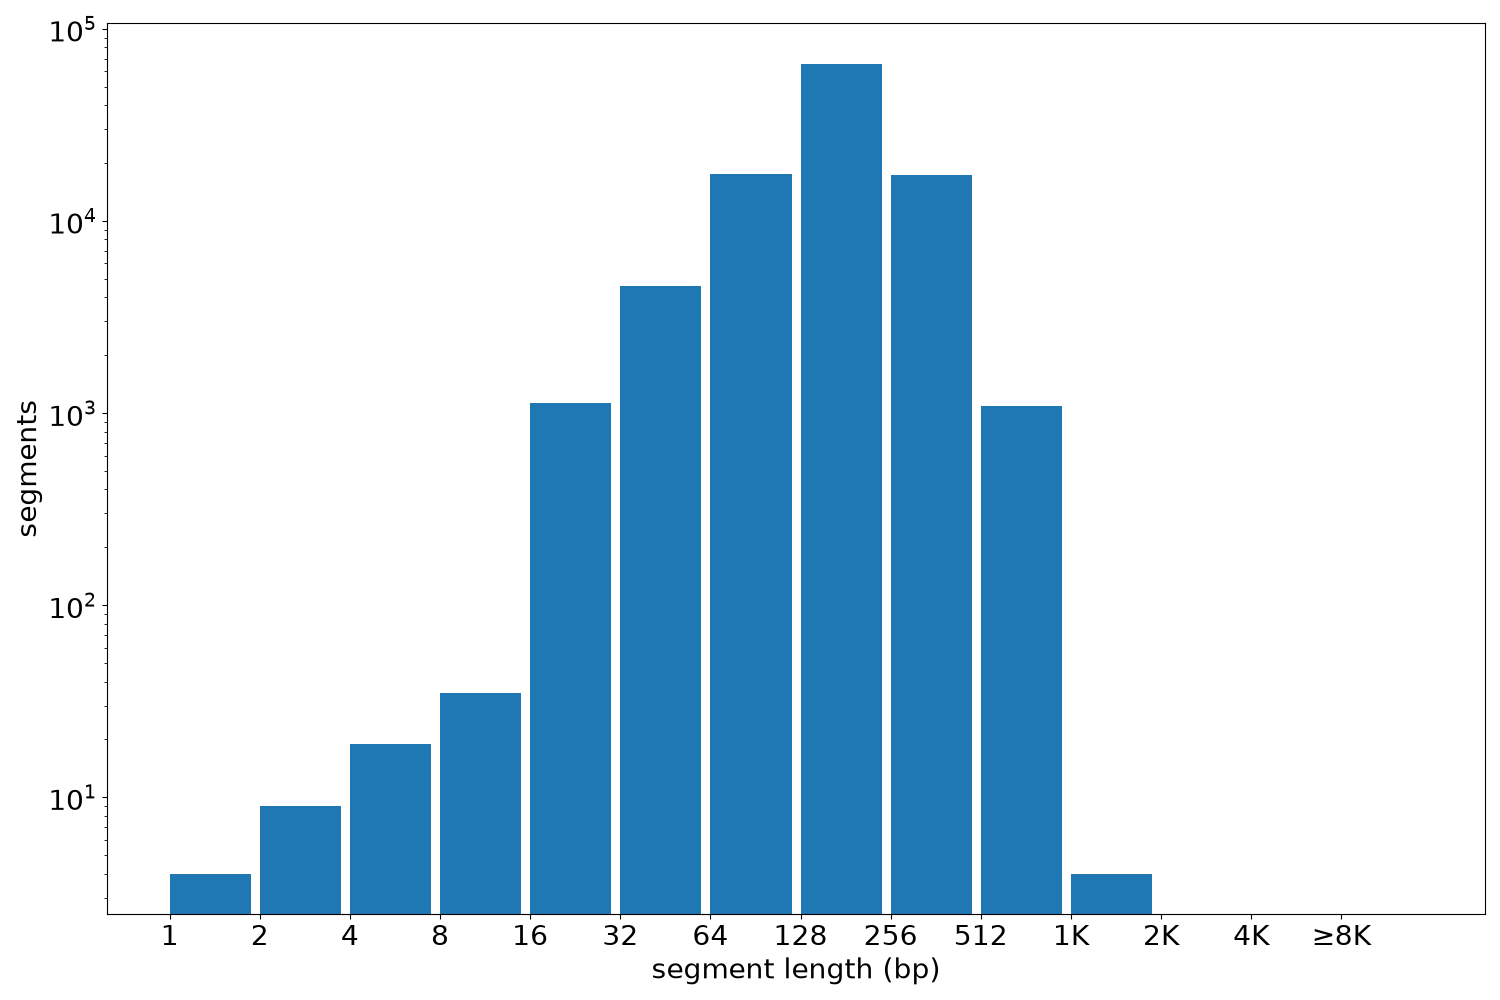
Segment lengths
| segments | min | max | mean | median | |
|---|---|---|---|---|---|
| segments | 107522 | 1 | 1240 | 192.34 | 180 |
Files
| Filename | Size | md5 |
|---|---|---|
| ENCFF155GXQ.bed.gz | 1.14 MB | fe8845a8a0c8803865044a5f1ba87fc8 |
| ENCFF155GXQ.tabix.bed.gz | 1.05 MB | 1a5c9c02682c4043294853b77bfb27c4 |
| ENCFF155GXQ.tabix.bed.gz.tbi | 382.26 KB | 4629e98ae99d3efeb78124bb4f859139 |
| genomic_resource.yaml | 2.17 KB | 084e40691f346cb2e5711dc55a974ec2 |
| statistics/ |