Resource
| Id | DNase-seq/ENCSR000EIX |
|---|---|
| Type | position_score |
| Version | 0 |
| Summary | DNase-seq ENCSR000EIX [biosample_summary="Homo sapiens AG20443"] |
| Description |
status: released biological_replicates: Rep 1 summary: output_type: peaks audit_internal_action: Released analysis {ENCAN099UZW|/analyses/ENCAN099UZW/} has in progress subobject document {1487091b-7d0c-484f-8beb-6a938c02a19c|/documents/1487091b-7d0c-484f-8beb-6a938c02a19c/} audit_warning: Signal Portion of Tags (SPOT) is a measure of enrichment, analogous to the commonly used fraction of reads in peaks metric. ENCODE processed alignment files {ENCFF442RTZ|/files/ENCFF442RTZ/} processed by DNase-seq ENCODE4 v3.0.0 GRCh38 pipeline ({ENCPL848KLD|/pipelines/ENCPL848KLD/}) for GRCh38 assembly have a SPOT1 score of 0.33. According to ENCODE standards, SPOT1 score of 0.4 or higher is considered a product of high quality data. Any sample with a SPOT1 score <0.3 should be targeted for replacement with a higher quality sample, and a SPOT1 score of 0.25 is considered minimally acceptable SPOT1 score of 0.25 is considered minimally acceptable for rare and hard to find primary tissues. (See {ENCODE DNase-seq data standards|/data-standards/dnase-seq-encode4/}) |
| Labels |
|
Scores (1)
| ID | Type | Default annotation | Description | Histogram | Range | Summary |
|---|---|---|---|---|---|---|
| DNase-seq_ENCSR000EIX | float |
DNase-seq_ENCSR000EIX |
DNase-seq ENCSR000EIX [biosample_summary="Homo sapiens AG20443"]
|
 |
[0.0286, 19.9] |
|
n counts base pairs; sd is the population standard deviation.
Coverage
| Chromosome | Covered positions | Covered % | Segments |
|---|---|---|---|
| all chromosomes | 35819019 | 1.11% | 191520 |
| chr1 | 3340191 | 1.34% | 17760 |
| chr2 | 2970488 | 1.23% | 15946 |
| chr3 | 2323268 | 1.17% | 12511 |
| chr4 | 1665355 | 0.88% | 8988 |
| chr5 | 1951386 | 1.07% | 10550 |
| chr6 | 2097569 | 1.23% | 11203 |
| chr7 | 1778324 | 1.12% | 9600 |
| chr8 | 1695667 | 1.17% | 9019 |
| chr9 | 1591110 | 1.15% | 8464 |
| chr10 | 1825994 | 1.36% | 9715 |
| chr11 | 1843717 | 1.36% | 9809 |
| chr12 | 1706688 | 1.28% | 9155 |
| chr13 | 874044 | 0.76% | 4723 |
| chr14 | 1095428 | 1.02% | 5808 |
| chr15 | 1207095 | 1.18% | 6412 |
| chr16 | 1117775 | 1.24% | 5920 |
| chr17 | 1574014 | 1.89% | 8273 |
| chr18 | 768558 | 0.96% | 4146 |
| chr19 | 1253616 | 2.14% | 6595 |
| chr20 | 978942 | 1.52% | 5227 |
| chr21 | 415600 | 0.89% | 2197 |
| chr22 | 726822 | 1.43% | 3882 |
| chrX | 974862 | 0.62% | 5367 |
| chrY | 42506 | 0.07% | 250 |
| 3342 contigs with no values (129077085 bp) | 0 | 0.00% | 0 |
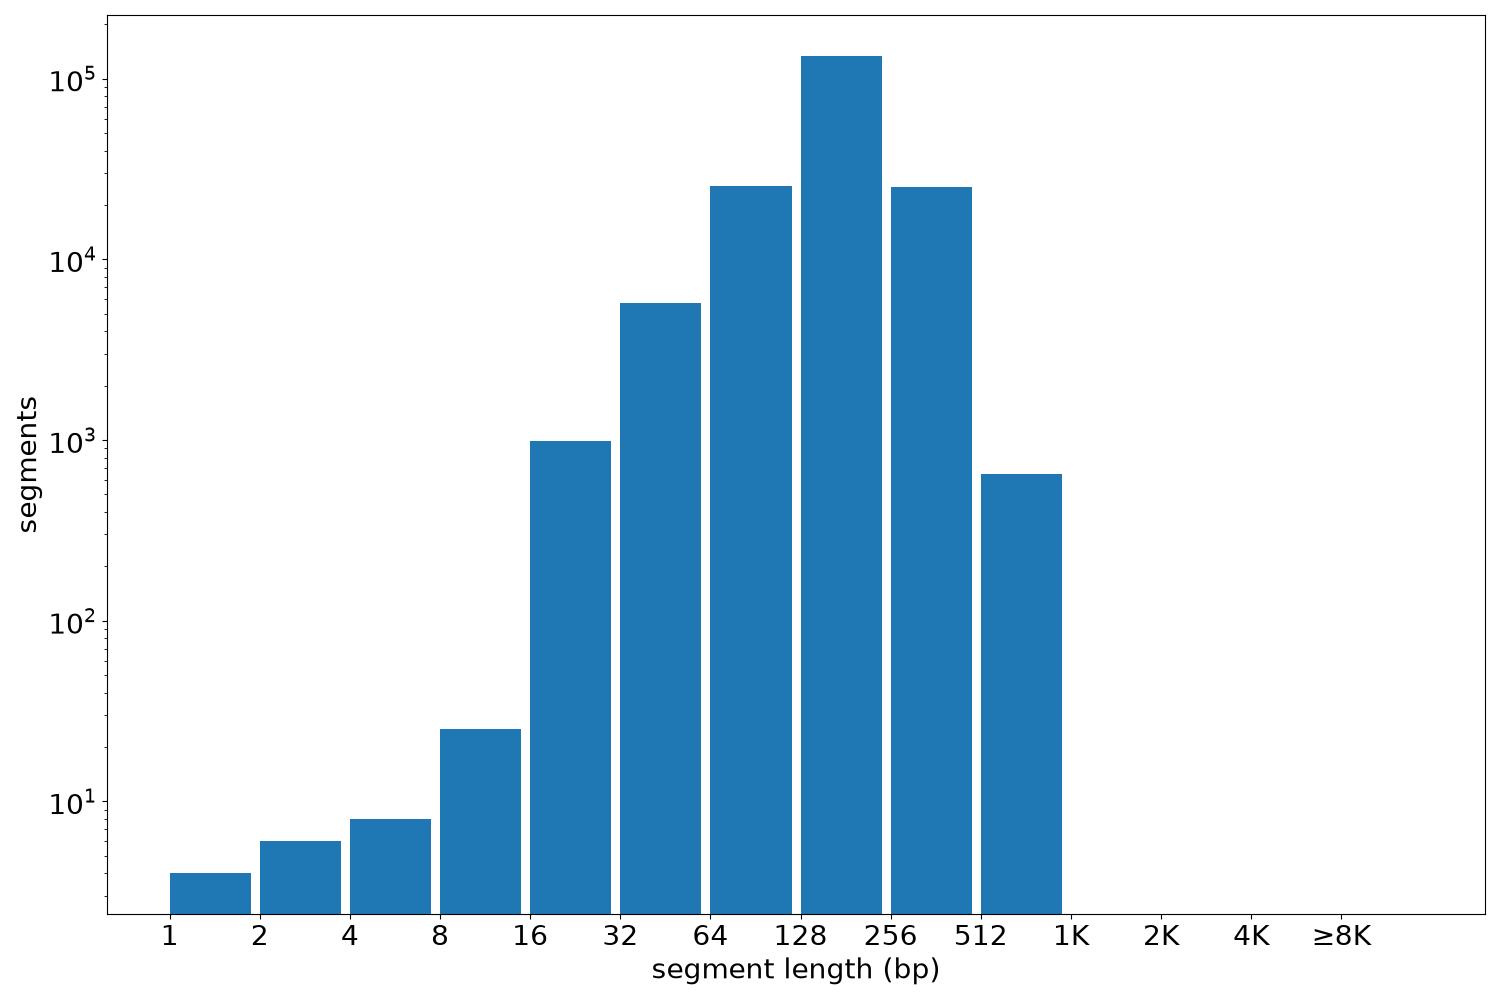
Segment lengths
| segments | min | max | mean | median | |
|---|---|---|---|---|---|
| segments | 191520 | 1 | 1000 | 187.02 | 180 |
Files
| Filename | Size | md5 |
|---|---|---|
| ENCFF833DLW.bed.gz | 2.05 MB | 2603a0aeb0b2928e226497f5d200cecf |
| ENCFF833DLW.tabix.bed.gz | 1.88 MB | 1157859a8342bbed383e35d387404745 |
| ENCFF833DLW.tabix.bed.gz.tbi | 585.73 KB | 7af9f0a1a4f32af30580f8389f80e48a |
| genomic_resource.yaml | 2.13 KB | e467e5eca3127dbbce7c1fc3a9260541 |
| statistics/ |