Resource
| Id | DNase-seq/ENCSR000EIW |
|---|---|
| Type | position_score |
| Version | 0 |
| Summary | DNase-seq ENCSR000EIW [biosample_summary="Homo sapiens AG08396"] |
| Description |
status: released biological_replicates: Rep 1 summary: output_type: peaks audit_internal_action: Released analysis {ENCAN474AWO|/analyses/ENCAN474AWO/} has in progress subobject document {14486326-4790-446f-898c-14d55308c748|/documents/14486326-4790-446f-898c-14d55308c748/} audit_warning: Signal Portion of Tags (SPOT) is a measure of enrichment, analogous to the commonly used fraction of reads in peaks metric. ENCODE processed alignment files {ENCFF653BZP|/files/ENCFF653BZP/} processed by DNase-seq ENCODE4 v3.0.0 GRCh38 pipeline ({ENCPL848KLD|/pipelines/ENCPL848KLD/}) for GRCh38 assembly have a SPOT1 score of 0.35. According to ENCODE standards, SPOT1 score of 0.4 or higher is considered a product of high quality data. Any sample with a SPOT1 score <0.3 should be targeted for replacement with a higher quality sample, and a SPOT1 score of 0.25 is considered minimally acceptable SPOT1 score of 0.25 is considered minimally acceptable for rare and hard to find primary tissues. (See {ENCODE DNase-seq data standards|/data-standards/dnase-seq-encode4/}) |
| Labels |
|
Scores (1)
| ID | Type | Default annotation | Description | Histogram | Range | Summary |
|---|---|---|---|---|---|---|
| DNase-seq_ENCSR000EIW | float |
DNase-seq_ENCSR000EIW |
DNase-seq ENCSR000EIW [biosample_summary="Homo sapiens AG08396"]
|
 |
[0.0394, 28.2] |
|
n counts base pairs; sd is the population standard deviation.
Coverage
| Chromosome | Covered positions | Covered % | Segments |
|---|---|---|---|
| all chromosomes | 25098956 | 0.78% | 137556 |
| chr1 | 2375633 | 0.95% | 12939 |
| chr2 | 1992647 | 0.82% | 10974 |
| chr3 | 1570319 | 0.79% | 8713 |
| chr4 | 1154154 | 0.61% | 6481 |
| chr5 | 1332057 | 0.73% | 7367 |
| chr6 | 1449698 | 0.85% | 7983 |
| chr7 | 1205067 | 0.76% | 6682 |
| chr8 | 1114563 | 0.77% | 6175 |
| chr9 | 1085410 | 0.78% | 5938 |
| chr10 | 1220198 | 0.91% | 6706 |
| chr11 | 1381462 | 1.02% | 7487 |
| chr12 | 1275870 | 0.96% | 6937 |
| chr13 | 591125 | 0.52% | 3265 |
| chr14 | 777326 | 0.73% | 4254 |
| chr15 | 838144 | 0.82% | 4536 |
| chr16 | 844779 | 0.94% | 4600 |
| chr17 | 1209506 | 1.45% | 6506 |
| chr18 | 501069 | 0.62% | 2768 |
| chr19 | 1081368 | 1.84% | 5652 |
| chr20 | 676133 | 1.05% | 3740 |
| chr21 | 274675 | 0.59% | 1502 |
| chr22 | 506020 | 1.00% | 2751 |
| chrX | 641562 | 0.41% | 3598 |
| chrY | 171 | <0.01% | 2 |
| 3342 contigs with no values (129077085 bp) | 0 | 0.00% | 0 |
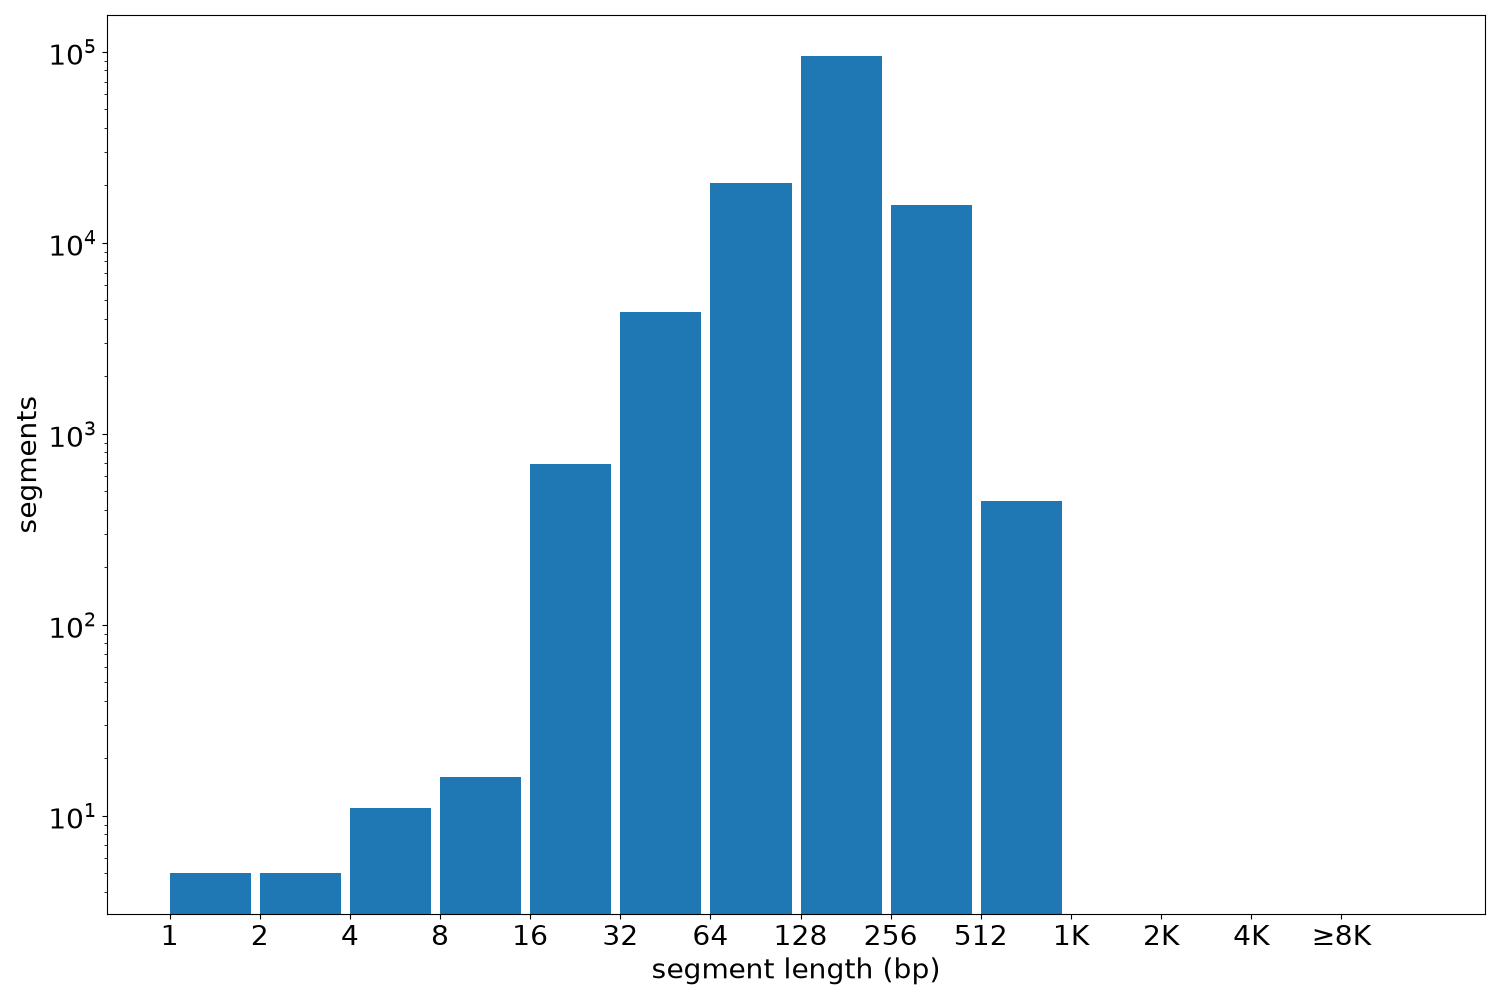
Segment lengths
| segments | min | max | mean | median | |
|---|---|---|---|---|---|
| segments | 137556 | 1 | 940 | 182.46 | 180 |
Files
| Filename | Size | md5 |
|---|---|---|
| ENCFF378HOL.bed.gz | 1.47 MB | 523506f105b21248ba5081ec96b95e8b |
| ENCFF378HOL.tabix.bed.gz | 1.34 MB | fce81f11d4b4e9dbfa82bb3d8c7078a1 |
| ENCFF378HOL.tabix.bed.gz.tbi | 495.06 KB | 7b365474755752429b22f1460b99d595 |
| genomic_resource.yaml | 2.13 KB | 6466aaa2ebaa8ff9eb805e9196e25101 |
| statistics/ |