Resource
| Id | DNase-seq/ENCSR000EIS |
|---|---|
| Type | position_score |
| Version | 0 |
| Summary | DNase-seq ENCSR000EIS [biosample_summary="Homo sapiens GM03348"] |
| Description |
status: released biological_replicates: Rep 1 summary: output_type: peaks audit_internal_action: Released analysis {ENCAN512YZL|/analyses/ENCAN512YZL/} has in progress subobject document {62a05412-799a-4a9d-bbb0-83c3ad0193f6|/documents/62a05412-799a-4a9d-bbb0-83c3ad0193f6/} audit_warning: Signal Portion of Tags (SPOT) is a measure of enrichment, analogous to the commonly used fraction of reads in peaks metric. ENCODE processed alignment files {ENCFF145STU|/files/ENCFF145STU/} processed by DNase-seq ENCODE4 v3.0.0 GRCh38 pipeline ({ENCPL848KLD|/pipelines/ENCPL848KLD/}) for GRCh38 assembly have a SPOT1 score of 0.40. According to ENCODE standards, SPOT1 score of 0.4 or higher is considered a product of high quality data. Any sample with a SPOT1 score <0.3 should be targeted for replacement with a higher quality sample, and a SPOT1 score of 0.25 is considered minimally acceptable SPOT1 score of 0.25 is considered minimally acceptable for rare and hard to find primary tissues. (See {ENCODE DNase-seq data standards|/data-standards/dnase-seq-encode4/}) |
| Labels |
|
Scores (1)
| ID | Type | Default annotation | Description | Histogram | Range | Summary |
|---|---|---|---|---|---|---|
| DNase-seq_ENCSR000EIS | float |
DNase-seq_ENCSR000EIS |
DNase-seq ENCSR000EIS [biosample_summary="Homo sapiens GM03348"]
|
 |
[0.0331, 25] |
|
n counts base pairs; sd is the population standard deviation.
Coverage
| Chromosome | Covered positions | Covered % | Segments |
|---|---|---|---|
| all chromosomes | 35732183 | 1.11% | 190099 |
| chr1 | 3331204 | 1.34% | 17657 |
| chr2 | 2959696 | 1.22% | 15831 |
| chr3 | 2361885 | 1.19% | 12665 |
| chr4 | 1785362 | 0.94% | 9580 |
| chr5 | 1987807 | 1.09% | 10584 |
| chr6 | 2171645 | 1.27% | 11516 |
| chr7 | 1797729 | 1.13% | 9623 |
| chr8 | 1732371 | 1.19% | 9137 |
| chr9 | 1552774 | 1.12% | 8228 |
| chr10 | 1765253 | 1.32% | 9387 |
| chr11 | 1825629 | 1.35% | 9697 |
| chr12 | 1766011 | 1.33% | 9361 |
| chr13 | 920079 | 0.80% | 4924 |
| chr14 | 1107503 | 1.03% | 5880 |
| chr15 | 1208321 | 1.18% | 6350 |
| chr16 | 1068707 | 1.18% | 5678 |
| chr17 | 1499468 | 1.80% | 7912 |
| chr18 | 774970 | 0.96% | 4163 |
| chr19 | 1119524 | 1.91% | 5938 |
| chr20 | 907024 | 1.41% | 4793 |
| chr21 | 412304 | 0.88% | 2151 |
| chr22 | 645782 | 1.27% | 3379 |
| chrX | 992497 | 0.64% | 5438 |
| chrY | 38638 | 0.07% | 227 |
| 3342 contigs with no values (129077085 bp) | 0 | 0.00% | 0 |
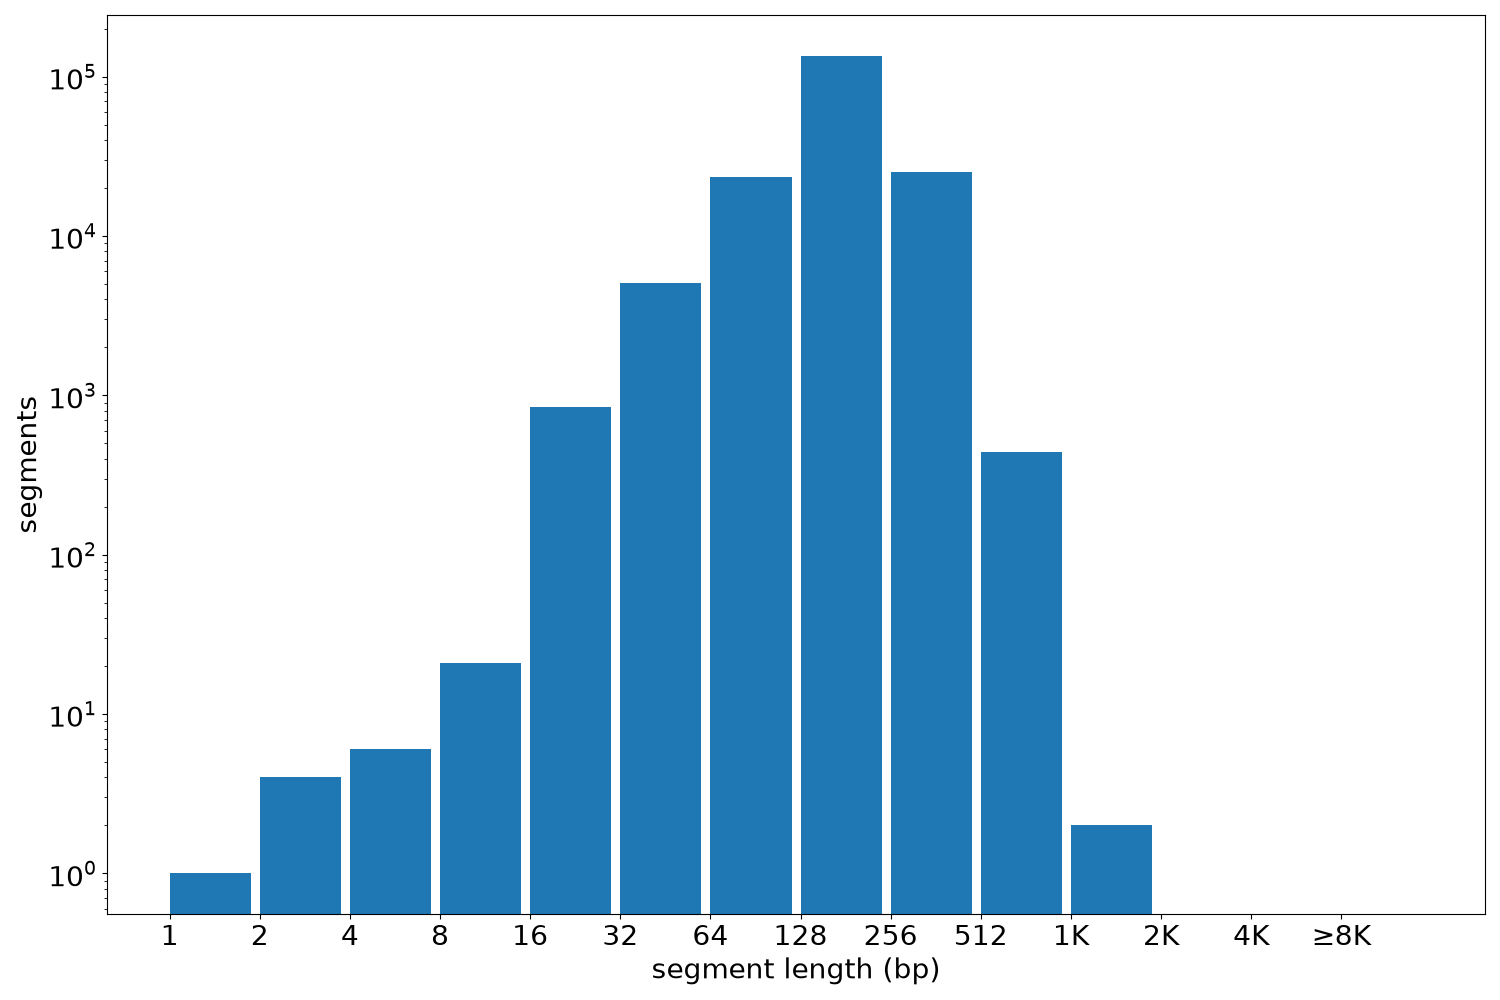
Segment lengths
| segments | min | max | mean | median | |
|---|---|---|---|---|---|
| segments | 190099 | 1 | 1080 | 187.97 | 180 |
Files
| Filename | Size | md5 |
|---|---|---|
| ENCFF292OFY.bed.gz | 2.02 MB | 746d770d4f5a9899d86e1881051f1784 |
| ENCFF292OFY.tabix.bed.gz | 1.86 MB | 9a8ec66e7970d04b9dcc8e183b6c2789 |
| ENCFF292OFY.tabix.bed.gz.tbi | 587.02 KB | c6e0a0656c8680213f23843b6ca61081 |
| genomic_resource.yaml | 2.13 KB | 9ac347d0ebd489125ab33824e9219fb3 |
| statistics/ |