Resource
| Id | DNase-seq/ENCSR000EIL |
|---|---|
| Type | position_score |
| Version | 0 |
| Summary | DNase-seq ENCSR000EIL [biosample_summary="Homo sapiens chorion tissue"] |
| Description |
status: released biological_replicates: Rep 1 summary: output_type: peaks audit_internal_action: Released analysis {ENCAN204BKY|/analyses/ENCAN204BKY/} has in progress subobject document {a46eb7a6-3bfb-4bcb-b1ef-c6c1006ff83c|/documents/a46eb7a6-3bfb-4bcb-b1ef-c6c1006ff83c/} audit_warning: Signal Portion of Tags (SPOT) is a measure of enrichment, analogous to the commonly used fraction of reads in peaks metric. ENCODE processed alignment files {ENCFF984FGZ|/files/ENCFF984FGZ/} processed by DNase-seq ENCODE4 v3.0.0 GRCh38 pipeline ({ENCPL848KLD|/pipelines/ENCPL848KLD/}) for GRCh38 assembly have a SPOT1 score of 0.39. According to ENCODE standards, SPOT1 score of 0.4 or higher is considered a product of high quality data. Any sample with a SPOT1 score <0.3 should be targeted for replacement with a higher quality sample, and a SPOT1 score of 0.25 is considered minimally acceptable SPOT1 score of 0.25 is considered minimally acceptable for rare and hard to find primary tissues. (See {ENCODE DNase-seq data standards|/data-standards/dnase-seq-encode4/}) |
| Labels |
|
Scores (1)
| ID | Type | Default annotation | Description | Histogram | Range | Summary |
|---|---|---|---|---|---|---|
| DNase-seq_ENCSR000EIL | float |
DNase-seq_ENCSR000EIL |
DNase-seq ENCSR000EIL [biosample_summary="Homo sapiens chorion tissue"]
|
 |
[0.0893, 21.9] |
|
n counts base pairs; sd is the population standard deviation.
Coverage
| Chromosome | Covered positions | Covered % | Segments |
|---|---|---|---|
| all chromosomes | 11882866 | 0.37% | 61777 |
| chr1 | 1081235 | 0.43% | 5656 |
| chr2 | 804400 | 0.33% | 4186 |
| chr3 | 571694 | 0.29% | 3016 |
| chr4 | 456587 | 0.24% | 2354 |
| chr5 | 488874 | 0.27% | 2622 |
| chr6 | 525017 | 0.31% | 2786 |
| chr7 | 594862 | 0.37% | 3106 |
| chr8 | 472928 | 0.33% | 2446 |
| chr9 | 567801 | 0.41% | 2906 |
| chr10 | 503950 | 0.38% | 2680 |
| chr11 | 753340 | 0.56% | 3877 |
| chr12 | 522672 | 0.39% | 2739 |
| chr13 | 190558 | 0.17% | 1023 |
| chr14 | 410021 | 0.38% | 2080 |
| chr15 | 346436 | 0.34% | 1871 |
| chr16 | 506773 | 0.56% | 2596 |
| chr17 | 805642 | 0.97% | 4115 |
| chr18 | 179375 | 0.22% | 962 |
| chr19 | 1013414 | 1.73% | 5088 |
| chr20 | 347961 | 0.54% | 1785 |
| chr21 | 153823 | 0.33% | 828 |
| chr22 | 385238 | 0.76% | 1952 |
| chrX | 195296 | 0.13% | 1068 |
| chrY | 4969 | 0.01% | 35 |
| 3342 contigs with no values (129077085 bp) | 0 | 0.00% | 0 |
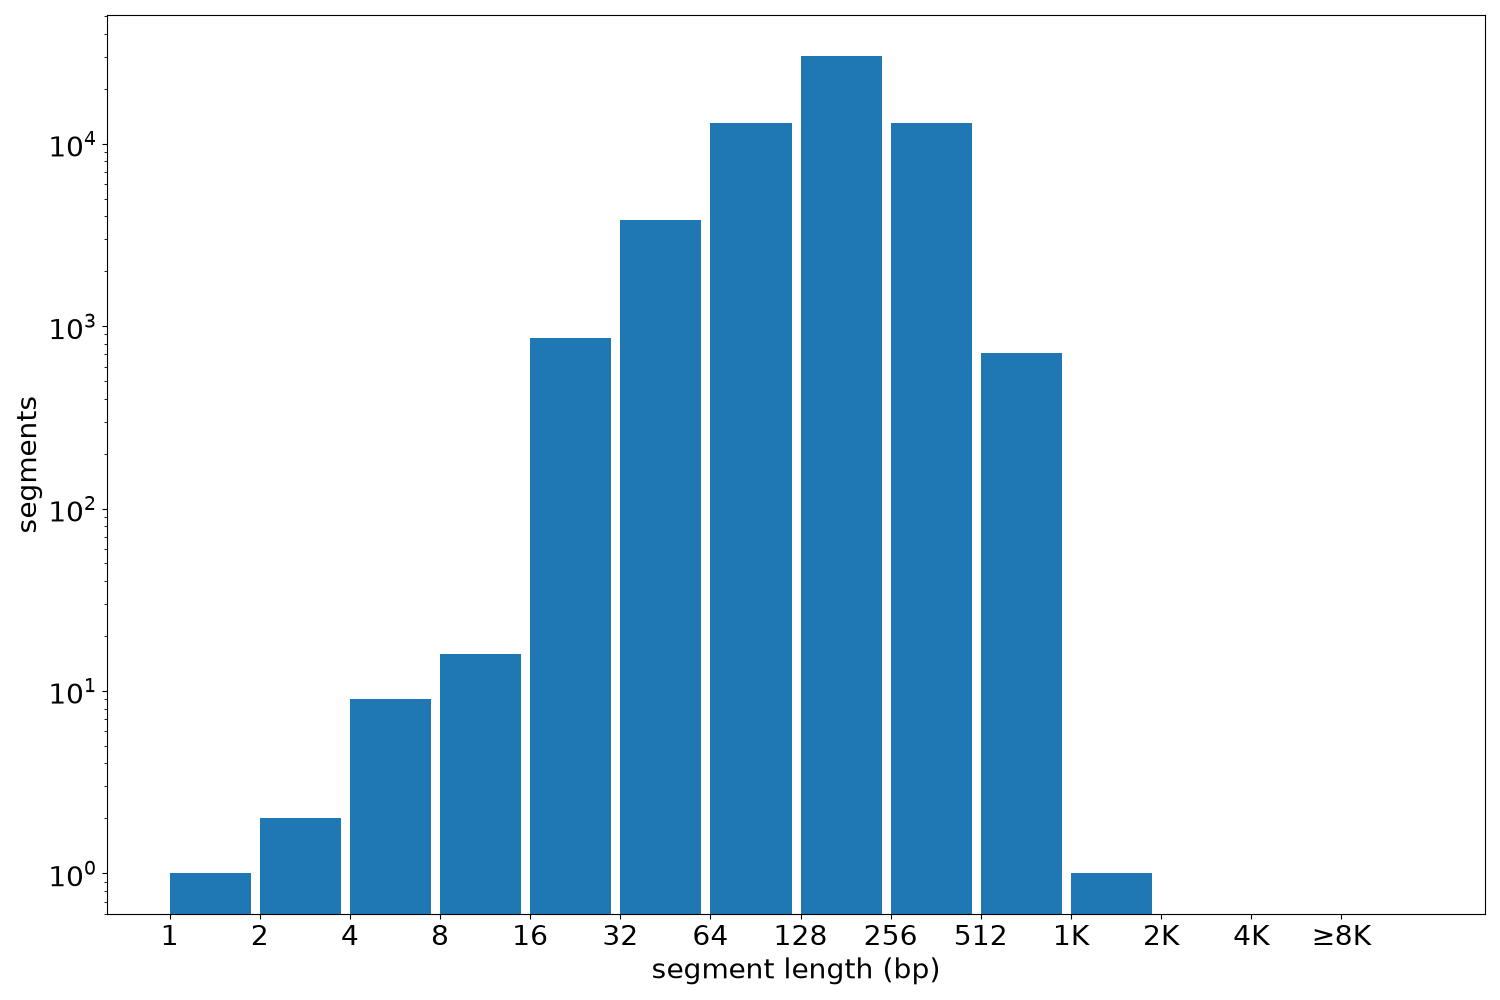
Segment lengths
| segments | min | max | mean | median | |
|---|---|---|---|---|---|
| segments | 61777 | 1 | 1145 | 192.35 | 180 |
Files
| Filename | Size | md5 |
|---|---|---|
| ENCFF517FIV.bed.gz | 649.97 KB | 0990ddf0ebf2173febbf06b2dece6c5f |
| ENCFF517FIV.tabix.bed.gz | 600.55 KB | 682bdc6bb1c3e1b4be46f7666d3f283f |
| ENCFF517FIV.tabix.bed.gz.tbi | 221.54 KB | f47a1437a288120d6650c1f94f164f20 |
| genomic_resource.yaml | 2.15 KB | d98af292a08e80d748251dcb641d330e |
| statistics/ |