Resource
| Id | DNase-seq/ENCSR000EIG |
|---|---|
| Type | position_score |
| Version | 0 |
| Summary | DNase-seq ENCSR000EIG [biosample_summary="Homo sapiens T-helper 1 cell"] |
| Description |
status: released biological_replicates: Rep 1 summary: mixed sex output_type: peaks audit_internal_action: Released analysis {ENCAN851RBF|/analyses/ENCAN851RBF/} has in progress subobject document {407a8056-be9f-49f1-ac32-5a5694b939c0|/documents/407a8056-be9f-49f1-ac32-5a5694b939c0/} audit_warning: Signal Portion of Tags (SPOT) is a measure of enrichment, analogous to the commonly used fraction of reads in peaks metric. ENCODE processed alignment files {ENCFF029NSD|/files/ENCFF029NSD/} processed by DNase-seq ENCODE4 v3.0.0 GRCh38 pipeline ({ENCPL848KLD|/pipelines/ENCPL848KLD/}) for GRCh38 assembly have a SPOT1 score of 0.39. According to ENCODE standards, SPOT1 score of 0.4 or higher is considered a product of high quality data. Any sample with a SPOT1 score <0.3 should be targeted for replacement with a higher quality sample, and a SPOT1 score of 0.25 is considered minimally acceptable SPOT1 score of 0.25 is considered minimally acceptable for rare and hard to find primary tissues. (See {ENCODE DNase-seq data standards|/data-standards/dnase-seq-encode4/}) |
| Labels |
|
Scores (1)
| ID | Type | Default annotation | Description | Histogram | Range | Summary |
|---|---|---|---|---|---|---|
| DNase-seq_ENCSR000EIG | float |
DNase-seq_ENCSR000EIG |
DNase-seq ENCSR000EIG [biosample_summary="Homo sapiens T-helper 1 cell"]
|
 |
[0.0948, 40.1] |
|
n counts base pairs; sd is the population standard deviation.
Coverage
| Chromosome | Covered positions | Covered % | Segments |
|---|---|---|---|
| all chromosomes | 16988420 | 0.53% | 101215 |
| chr1 | 1589361 | 0.64% | 9376 |
| chr2 | 1113979 | 0.46% | 6667 |
| chr3 | 806888 | 0.41% | 4909 |
| chr4 | 558832 | 0.29% | 3473 |
| chr5 | 659396 | 0.36% | 3998 |
| chr6 | 695649 | 0.41% | 4217 |
| chr7 | 768331 | 0.48% | 4603 |
| chr8 | 590956 | 0.41% | 3490 |
| chr9 | 777573 | 0.56% | 4684 |
| chr10 | 624244 | 0.47% | 3737 |
| chr11 | 999455 | 0.74% | 5881 |
| chr12 | 822624 | 0.62% | 4936 |
| chr13 | 253465 | 0.22% | 1596 |
| chr14 | 557861 | 0.52% | 3333 |
| chr15 | 459846 | 0.45% | 2772 |
| chr16 | 864344 | 0.96% | 5082 |
| chr17 | 1293290 | 1.55% | 7561 |
| chr18 | 205587 | 0.26% | 1250 |
| chr19 | 1593989 | 2.72% | 9044 |
| chr20 | 503126 | 0.78% | 3003 |
| chr21 | 204546 | 0.44% | 1213 |
| chr22 | 708042 | 1.39% | 4219 |
| chrX | 327747 | 0.21% | 2110 |
| chrY | 9289 | 0.02% | 61 |
| 3342 contigs with no values (129077085 bp) | 0 | 0.00% | 0 |
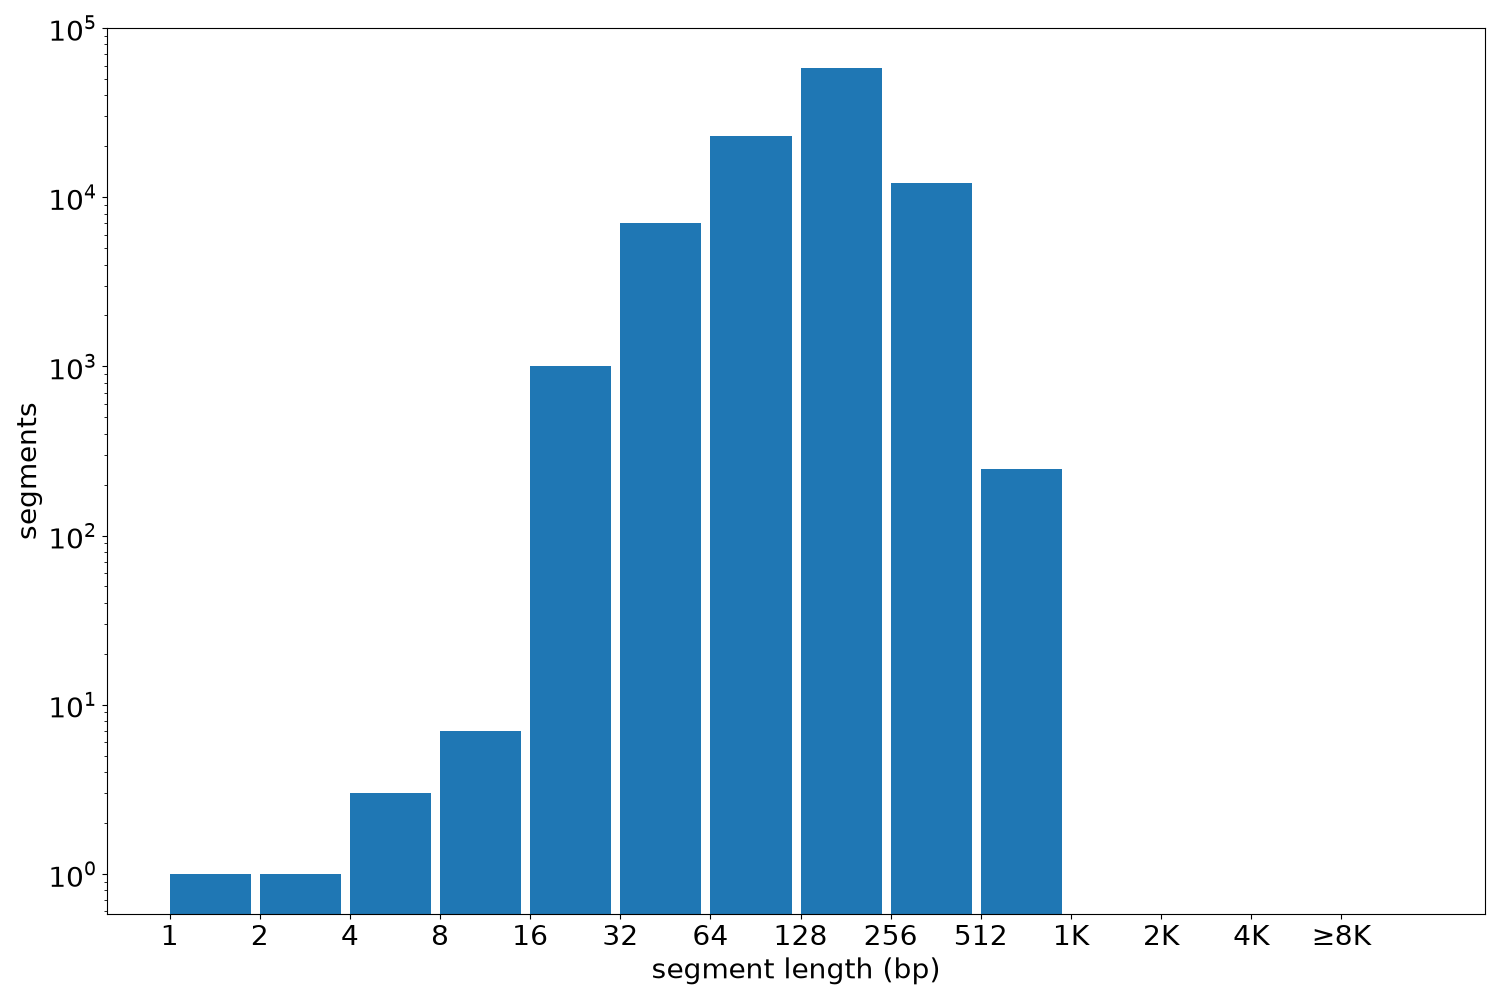
Segment lengths
| segments | min | max | mean | median | |
|---|---|---|---|---|---|
| segments | 101215 | 1 | 920 | 167.84 | 160 |
Files
| Filename | Size | md5 |
|---|---|---|
| ENCFF406MTD.bed.gz | 1.03 MB | 077536e409df075ef77691527be9a7fc |
| ENCFF406MTD.tabix.bed.gz | 960.56 KB | f254a97e6e1cdffea7f54c6738330fde |
| ENCFF406MTD.tabix.bed.gz.tbi | 270.04 KB | abf626d229befac9053c8d761fa488de |
| genomic_resource.yaml | 2.14 KB | 4d3b0e6b64f3c89894ed878af8d9f434 |
| statistics/ |