Resource
| Id | ATAC-seq/ENCSR863TVR |
|---|---|
| Type | position_score |
| Version | 0 |
| Summary | ATAC-seq ENCSR863TVR [biosample_summary="Homo sapiens stimulated activated naive CD8-positive, alpha-beta T cell male adult (33 years) treated with anti-CD3 and anti-CD28 coated beads for 72 hours, 100 ng/mL Interleukin-15 for 72 hours"] |
| Description |
status: released biological_replicates: Rep 1, Rep 2 summary: male adult (33 years) treated with anti-CD3 and anti-CD28 coated beads for 72 hours, 100 ng/mL Interleukin-15 for 72 hours output_type: pseudoreplicated peaks audit_error: Alignment file {ENCFF698LXZ|/files/ENCFF698LXZ/} processed by ATAC-seq ENCODE4 v1.10.0 GRCh38 pipeline has 9618570 usable fragments. According to ENCODE4 standards, ATAC-seq assays processed by the uniform processing pipeline should have > 25 million usable fragments. 20-25 million is acceptable and < 15 million is not compliant. audit_internal_action: Released analysis {ENCAN354YJJ|/analyses/ENCAN354YJJ/} has in progress subobject quality standard {encode4-atac-seq|/quality-standards/encode4-atac-seq/} audit_not_compliant: NRF (Non Redundant Fraction) is equal to the result of the division of the number of reads after duplicates removal by the total number of reads. An NRF value < 0.7 is poor complexity, between 0.7 and 0.9 is moderate complexity, and >= 0.9 high complexity. NRF value > 0.9 is recommended, but > 0.7 is acceptable. ENCODE processed file {ENCFF187EQF|/files/ENCFF187EQF/} processed by ATAC-seq ENCODE4 v1.10.0 GRCh38 pipeline was generated from a library with NRF value of 0.475579. audit_not_compliant: PBC1 (PCR Bottlenecking Coefficient 1, M1/M_distinct) is the ratio of the number of genomic locations where exactly one read maps uniquely (M1) to the number of genomic locations where some reads map (M_distinct). A PBC1 value in the range 0 - 0.5 is severe bottlenecking, 0.5 - 0.8 is moderate bottlenecking, 0.8 - 0.9 is mild bottlenecking, and > 0.9 is no bottlenecking. PBC1 value > 0.9 is recommended, but > 0.7 is acceptable. ENCODE processed file {ENCFF187EQF|/files/ENCFF187EQF/} processed by ATAC-seq ENCODE4 v1.10.0 GRCh38 pipeline was generated from a library with a PBC1 value of 0.43. audit_not_compliant: NRF (Non Redundant Fraction) is equal to the result of the division of the number of reads after duplicates removal by the total number of reads. An NRF value < 0.7 is poor complexity, between 0.7 and 0.9 is moderate complexity, and >= 0.9 high complexity. NRF value > 0.9 is recommended, but > 0.7 is acceptable. ENCODE processed file {ENCFF698LXZ|/files/ENCFF698LXZ/} processed by ATAC-seq ENCODE4 v1.10.0 GRCh38 pipeline was generated from a library with NRF value of 0.298057. audit_not_compliant: PBC1 (PCR Bottlenecking Coefficient 1, M1/M_distinct) is the ratio of the number of genomic locations where exactly one read maps uniquely (M1) to the number of genomic locations where some reads map (M_distinct). A PBC1 value in the range 0 - 0.5 is severe bottlenecking, 0.5 - 0.8 is moderate bottlenecking, 0.8 - 0.9 is mild bottlenecking, and > 0.9 is no bottlenecking. PBC1 value > 0.9 is recommended, but > 0.7 is acceptable. ENCODE processed file {ENCFF698LXZ|/files/ENCFF698LXZ/} processed by ATAC-seq ENCODE4 v1.10.0 GRCh38 pipeline was generated from a library with a PBC1 value of 0.22. audit_warning: Alignment file {ENCFF187EQF|/files/ENCFF187EQF/} processed by ATAC-seq ENCODE4 v1.10.0 GRCh38 pipeline has 20481701 usable fragments. According to ENCODE4 standards, ATAC-seq assays processed by the uniform processing pipeline should have > 25 million usable fragments. 20-25 million is acceptable and < 15 million is not compliant. audit_warning: PBC2 (PCR Bottlenecking Coefficient 2, M1/M2) is the ratio of the number of genomic locations where exactly one read maps uniquely (M1) to the number of genomic locations where two reads map uniquely (M2). A PBC2 value in the range 0 - 1 is severe bottlenecking, 1 - 3 is moderate bottlenecking, 3 - 10 is mild bottlenecking, > 10 is no bottlenecking. PBC2 value > 10 is recommended, but > 3 is acceptable. ENCODE processed file {ENCFF187EQF|/files/ENCFF187EQF/} processed by ATAC-seq ENCODE4 v1.10.0 GRCh38 pipeline was generated from a library with a PBC2 value of 1.51. audit_warning: PBC2 (PCR Bottlenecking Coefficient 2, M1/M2) is the ratio of the number of genomic locations where exactly one read maps uniquely (M1) to the number of genomic locations where two reads map uniquely (M2). A PBC2 value in the range 0 - 1 is severe bottlenecking, 1 - 3 is moderate bottlenecking, 3 - 10 is mild bottlenecking, > 10 is no bottlenecking. PBC2 value > 10 is recommended, but > 3 is acceptable. ENCODE processed file {ENCFF698LXZ|/files/ENCFF698LXZ/} processed by ATAC-seq ENCODE4 v1.10.0 GRCh38 pipeline was generated from a library with a PBC2 value of 1.10. audit_warning: According to ENCODE4 standards, overlap peaks files in ATAC-seq assays processed by the uniform processing pipeline should have FRiP (fraction of reads in called peak regions) scores > 0.3. FRiP scores 0.2-0.3 are acceptable, and < 0.2 are not compliant. {ENCFF754SOL|/files/ENCFF754SOL/} processed by ATAC-seq ENCODE4 v1.10.0 GRCh38 pipeline has a FRiP score of 0.48. |
| Labels |
|
Scores (1)
| ID | Type | Default annotation | Description | Histogram | Range | Summary |
|---|---|---|---|---|---|---|
| ATAC-seq_ENCSR863TVR | float |
ATAC-seq_ENCSR863TVR |
ATAC-seq ENCSR863TVR [biosample_summary="Homo sapiens stimulated activated naive CD8-positive, alpha-beta T cell male adult (33 years) treated with anti-CD3 and anti-CD28 coated beads for 72 hours, 100 ng/mL Interleukin-15 for 72 hours"]
|
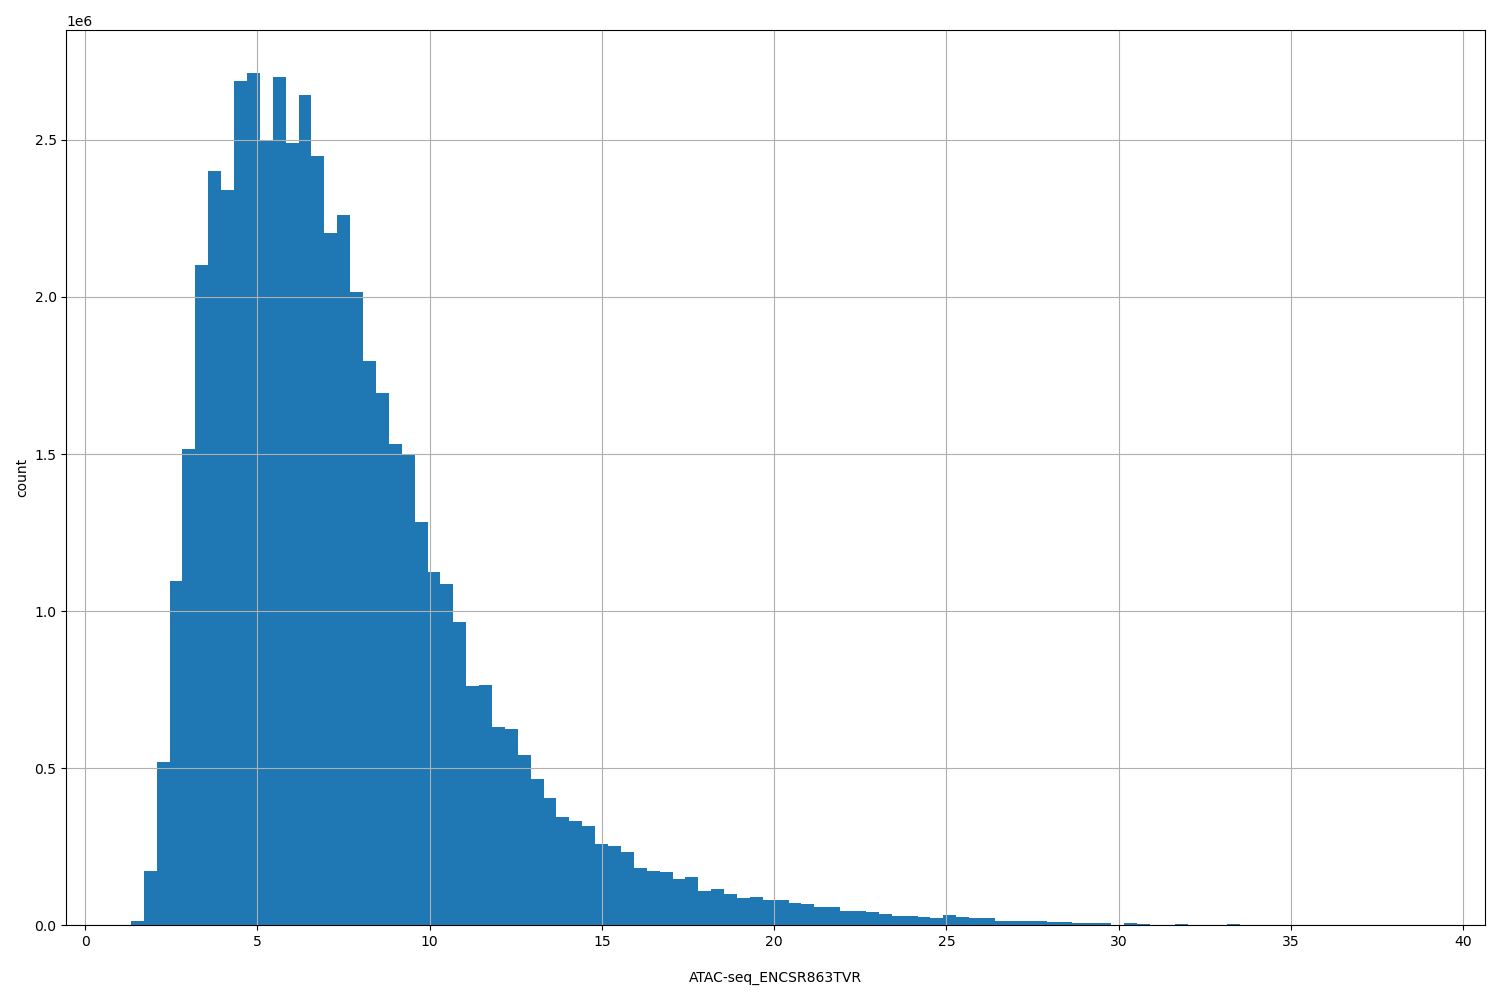 |
[1.33, 38.8] |
|
n counts base pairs; sd is the population standard deviation.
Coverage
| Chromosome | Covered positions | Covered % | Segments |
|---|---|---|---|
| all chromosomes | 54018532 | 1.68% | 99392 |
| chr1 | 5368543 | 2.16% | 9709 |
| chr2 | 4311197 | 1.78% | 8160 |
| chr3 | 3355342 | 1.69% | 6309 |
| chr4 | 2206280 | 1.16% | 4163 |
| chr5 | 2650328 | 1.46% | 4995 |
| chr6 | 3284033 | 1.92% | 6125 |
| chr7 | 2718859 | 1.71% | 5012 |
| chr8 | 2247594 | 1.55% | 4280 |
| chr9 | 2176932 | 1.57% | 4037 |
| chr10 | 2509115 | 1.88% | 4658 |
| chr11 | 2637150 | 1.95% | 4760 |
| chr12 | 2692866 | 2.02% | 4863 |
| chr13 | 1290090 | 1.13% | 2469 |
| chr14 | 1862576 | 1.74% | 3499 |
| chr15 | 1811195 | 1.78% | 3349 |
| chr16 | 1916255 | 2.12% | 3366 |
| chr17 | 2685964 | 3.23% | 4751 |
| chr18 | 997426 | 1.24% | 1934 |
| chr19 | 2316375 | 3.95% | 3857 |
| chr20 | 1401884 | 2.18% | 2583 |
| chr21 | 717255 | 1.54% | 1298 |
| chr22 | 1132709 | 2.23% | 2019 |
| chrX | 1624179 | 1.04% | 2978 |
| chrY | 104385 | 0.18% | 218 |
| 3342 contigs with no values (129077085 bp) | 0 | 0.00% | 0 |
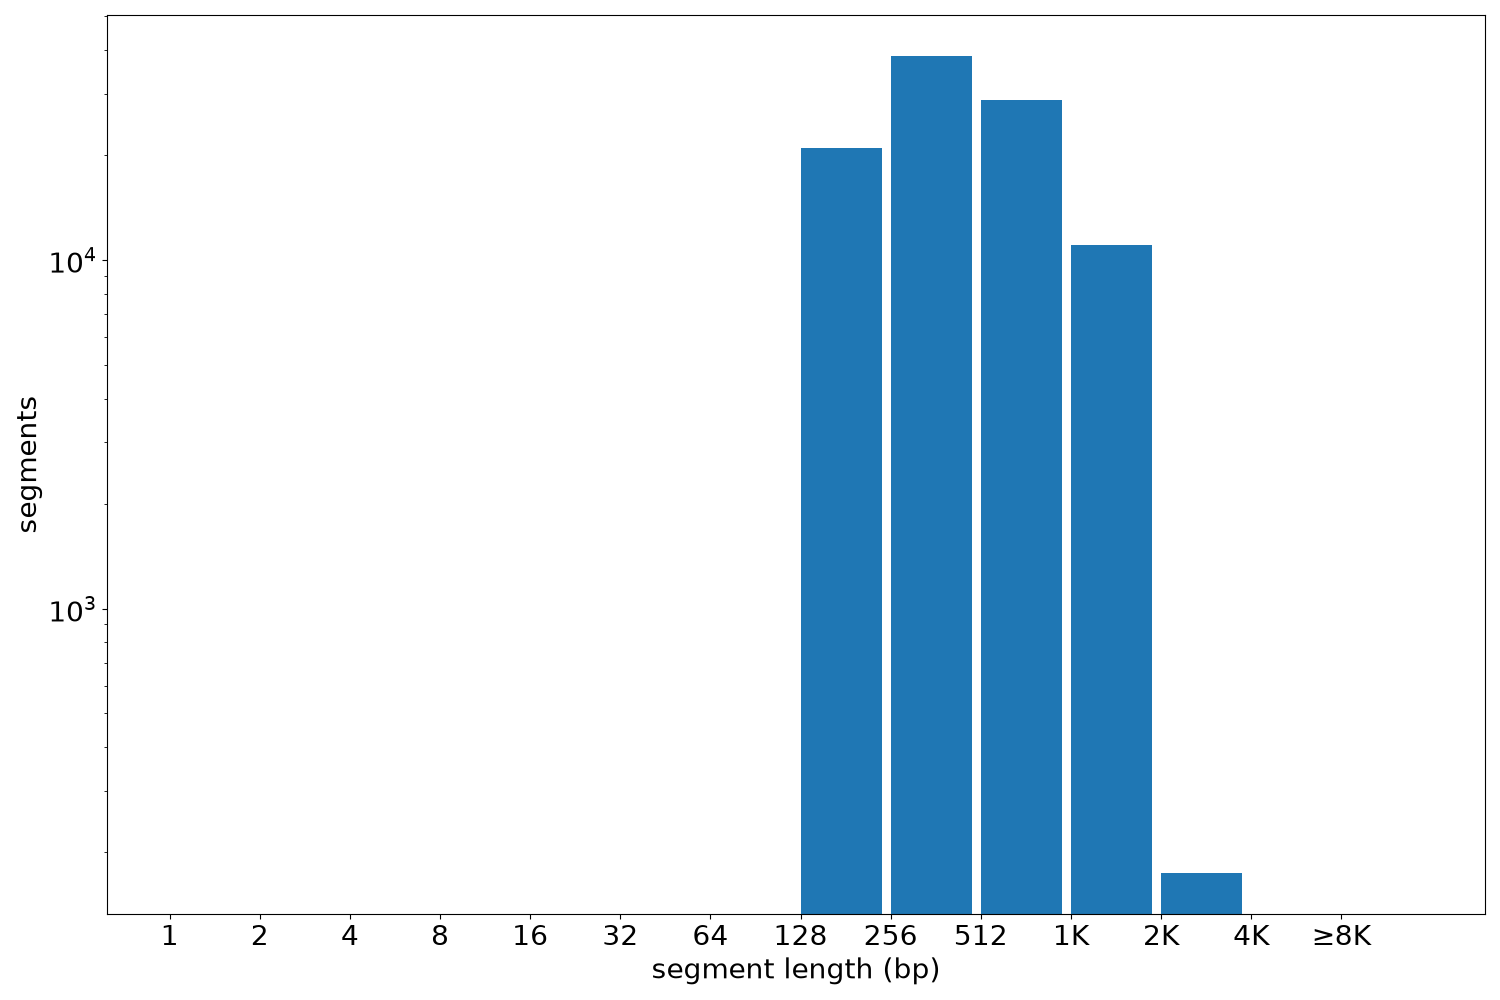
Segment lengths
| segments | min | max | mean | median | |
|---|---|---|---|---|---|
| segments | 99392 | 150 | 3008 | 543.49 | 427 |
Files
| Filename | Size | md5 |
|---|---|---|
| ENCFF754SOL.bed.gz | 4.24 MB | 6c92ea00f17178ac438387e51c5b2ed7 |
| ENCFF754SOL.tabix.bed.gz | 1.09 MB | e341b1c897e80f02c8dd581e6a4737f4 |
| ENCFF754SOL.tabix.bed.gz.tbi | 398.4 KB | d5bfa172ebe4778f62416eee359da4fd |
| genomic_resource.yaml | 6.94 KB | 991e9eb7d69b3e8dfe23c67715e88627 |
| statistics/ |