Resource
| Id | ATAC-seq/ENCSR619LHF |
|---|---|
| Type | position_score |
| Version | 0 |
| Summary | ATAC-seq ENCSR619LHF [biosample_summary="Homo sapiens sciatic nerve tissue female adult (47 years)"] |
| Description |
status: released biological_replicates: Rep 1 summary: female adult (47 years) output_type: pseudoreplicated peaks audit_internal_action: Released analysis {ENCAN739PTL|/analyses/ENCAN739PTL/} has in progress subobject quality standard {encode4-atac-seq|/quality-standards/encode4-atac-seq/} audit_not_compliant: According to ENCODE4 standards, overlap peaks files in ATAC-seq assays processed by the uniform processing pipeline should have FRiP (fraction of reads in called peak regions) scores > 0.3. FRiP scores 0.2-0.3 are acceptable, and < 0.2 are not compliant. {ENCFF779SAR|/files/ENCFF779SAR/} processed by ATAC-seq ENCODE4 v1.9.1 GRCh38 pipeline has a FRiP score of 0.13. audit_warning: NRF (Non Redundant Fraction) is equal to the result of the division of the number of reads after duplicates removal by the total number of reads. An NRF value < 0.7 is poor complexity, between 0.7 and 0.9 is moderate complexity, and >= 0.9 high complexity. NRF value > 0.9 is recommended, but > 0.7 is acceptable. ENCODE processed file {ENCFF584LRY|/files/ENCFF584LRY/} processed by ATAC-seq ENCODE4 v1.9.1 GRCh38 pipeline was generated from a library with NRF value of 0.888515. audit_warning: PBC1 (PCR Bottlenecking Coefficient 1, M1/M_distinct) is the ratio of the number of genomic locations where exactly one read maps uniquely (M1) to the number of genomic locations where some reads map (M_distinct). A PBC1 value in the range 0 - 0.5 is severe bottlenecking, 0.5 - 0.8 is moderate bottlenecking, 0.8 - 0.9 is mild bottlenecking, and > 0.9 is no bottlenecking. PBC1 value > 0.9 is recommended, but > 0.7 is acceptable. ENCODE processed file {ENCFF584LRY|/files/ENCFF584LRY/} processed by ATAC-seq ENCODE4 v1.9.1 GRCh38 pipeline was generated from a library with a PBC1 value of 0.89. |
| Labels |
|
Scores (1)
| ID | Type | Default annotation | Description | Histogram | Range | Summary |
|---|---|---|---|---|---|---|
| ATAC-seq_ENCSR619LHF | float |
ATAC-seq_ENCSR619LHF |
ATAC-seq ENCSR619LHF [biosample_summary="Homo sapiens sciatic nerve tissue female adult (47 years)"]
|
 |
[1.37, 30.7] |
|
n counts base pairs; sd is the population standard deviation.
Coverage
| Chromosome | Covered positions | Covered % | Segments |
|---|---|---|---|
| all chromosomes | 69376037 | 2.16% | 116849 |
| chr1 | 6251934 | 2.51% | 10186 |
| chr2 | 5498114 | 2.27% | 9483 |
| chr3 | 4299065 | 2.17% | 7394 |
| chr4 | 3229072 | 1.70% | 5767 |
| chr5 | 3854721 | 2.12% | 6817 |
| chr6 | 4060553 | 2.38% | 7073 |
| chr7 | 3571409 | 2.24% | 6249 |
| chr8 | 3196750 | 2.20% | 5663 |
| chr9 | 3089752 | 2.23% | 5197 |
| chr10 | 3454138 | 2.58% | 5942 |
| chr11 | 3554240 | 2.63% | 5815 |
| chr12 | 3291841 | 2.47% | 5540 |
| chr13 | 1888584 | 1.65% | 3358 |
| chr14 | 2158793 | 2.02% | 3630 |
| chr15 | 2202627 | 2.16% | 3664 |
| chr16 | 2302749 | 2.55% | 3595 |
| chr17 | 3161670 | 3.80% | 4827 |
| chr18 | 1486324 | 1.85% | 2736 |
| chr19 | 2612425 | 4.46% | 3730 |
| chr20 | 1810893 | 2.81% | 3045 |
| chr21 | 1020890 | 2.19% | 1685 |
| chr22 | 1465547 | 2.88% | 2323 |
| chrX | 1912243 | 1.23% | 3123 |
| chrY | 1703 | <0.01% | 7 |
| 3342 contigs with no values (129077085 bp) | 0 | 0.00% | 0 |
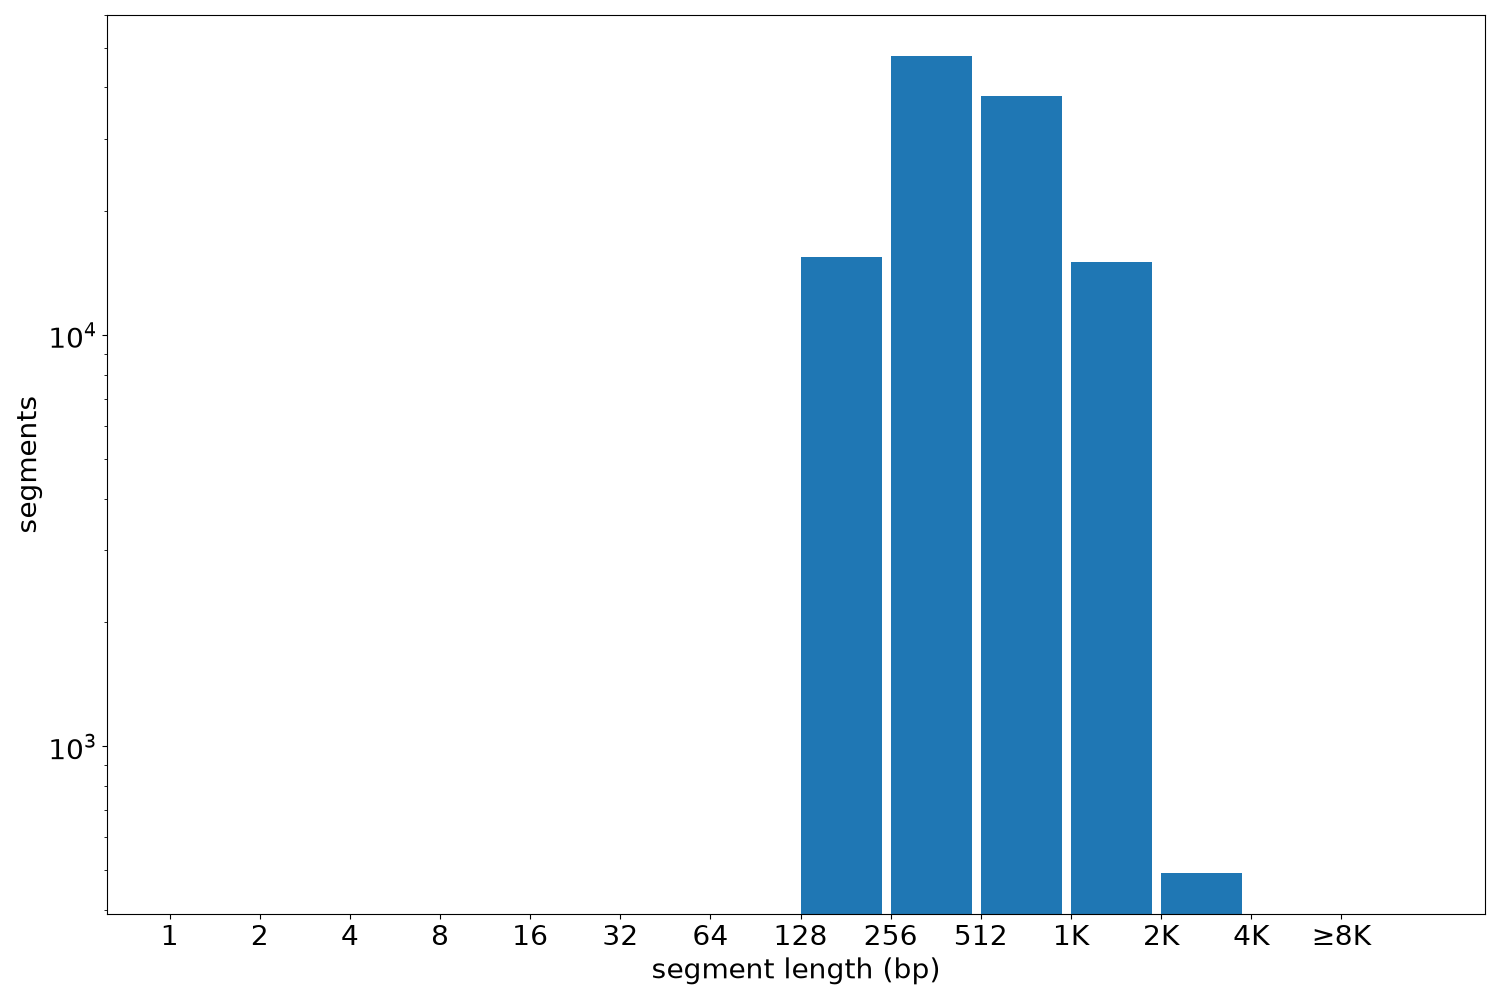
Segment lengths
| segments | min | max | mean | median | |
|---|---|---|---|---|---|
| segments | 116849 | 150 | 3999 | 593.72 | 478 |
Files
| Filename | Size | md5 |
|---|---|---|
| ENCFF779SAR.bed.gz | 4.42 MB | 98aa13a48099933e662962eaba67022d |
| ENCFF779SAR.tabix.bed.gz | 1.27 MB | f39de2efaee12fe20fb4b437846d71d8 |
| ENCFF779SAR.tabix.bed.gz.tbi | 476.01 KB | 05b4f9195a94254bf2ba487198124277 |
| genomic_resource.yaml | 3.34 KB | 847c14b4ca8923746f8b68ede09f48b0 |
| statistics/ |