Resource
| Id | ATAC-seq/ENCSR477YSU |
|---|---|
| Type | position_score |
| Version | 0 |
| Summary | ATAC-seq ENCSR477YSU [biosample_summary="Homo sapiens activated naive CD8-positive, alpha-beta T cell male adult (42 years) treated with anti-CD3 and anti-CD28 coated beads for 24 hours, 50 U/mL Interleukin-2 for 24 hours"] |
| Description |
status: released biological_replicates: Rep 1 summary: male adult (42 years) treated with anti-CD3 and anti-CD28 coated beads for 24 hours, 50 U/mL Interleukin-2 for 24 hours output_type: pseudoreplicated peaks audit_internal_action: Released analysis {ENCAN654VPE|/analyses/ENCAN654VPE/} has in progress subobject quality standard {encode4-atac-seq|/quality-standards/encode4-atac-seq/} |
| Labels |
|
Scores (1)
| ID | Type | Default annotation | Description | Histogram | Range | Summary |
|---|---|---|---|---|---|---|
| ATAC-seq_ENCSR477YSU | float |
ATAC-seq_ENCSR477YSU |
ATAC-seq ENCSR477YSU [biosample_summary="Homo sapiens activated naive CD8-positive, alpha-beta T cell male adult (42 years) treated with anti-CD3 and anti-CD28 coated beads for 24 hours, 50 U/mL Interleukin-2 for 24 hours"]
|
 |
[1.49, 36.4] |
|
n counts base pairs; sd is the population standard deviation.
Coverage
| Chromosome | Covered positions | Covered % | Segments |
|---|---|---|---|
| all chromosomes | 48955843 | 1.52% | 101358 |
| chr1 | 4877512 | 1.96% | 9965 |
| chr2 | 3991831 | 1.65% | 8503 |
| chr3 | 3124549 | 1.58% | 6629 |
| chr4 | 1957460 | 1.03% | 4163 |
| chr5 | 2422939 | 1.33% | 5151 |
| chr6 | 3012810 | 1.76% | 6310 |
| chr7 | 2440111 | 1.53% | 5117 |
| chr8 | 2106344 | 1.45% | 4479 |
| chr9 | 1964115 | 1.42% | 4079 |
| chr10 | 2335827 | 1.75% | 4911 |
| chr11 | 2374901 | 1.76% | 4874 |
| chr12 | 2441187 | 1.83% | 4974 |
| chr13 | 1193865 | 1.04% | 2583 |
| chr14 | 1661941 | 1.55% | 3441 |
| chr15 | 1639089 | 1.61% | 3414 |
| chr16 | 1718153 | 1.90% | 3397 |
| chr17 | 2355018 | 2.83% | 4660 |
| chr18 | 898201 | 1.12% | 1987 |
| chr19 | 2049098 | 3.50% | 3721 |
| chr20 | 1306915 | 2.03% | 2731 |
| chr21 | 643688 | 1.38% | 1339 |
| chr22 | 1022100 | 2.01% | 2034 |
| chrX | 1342198 | 0.86% | 2717 |
| chrY | 75991 | 0.13% | 179 |
| 3342 contigs with no values (129077085 bp) | 0 | 0.00% | 0 |
Segment lengths
| segments | min | max | mean | median | |
|---|---|---|---|---|---|
| segments | 101358 | 150 | 2689 | 483 | 391 |
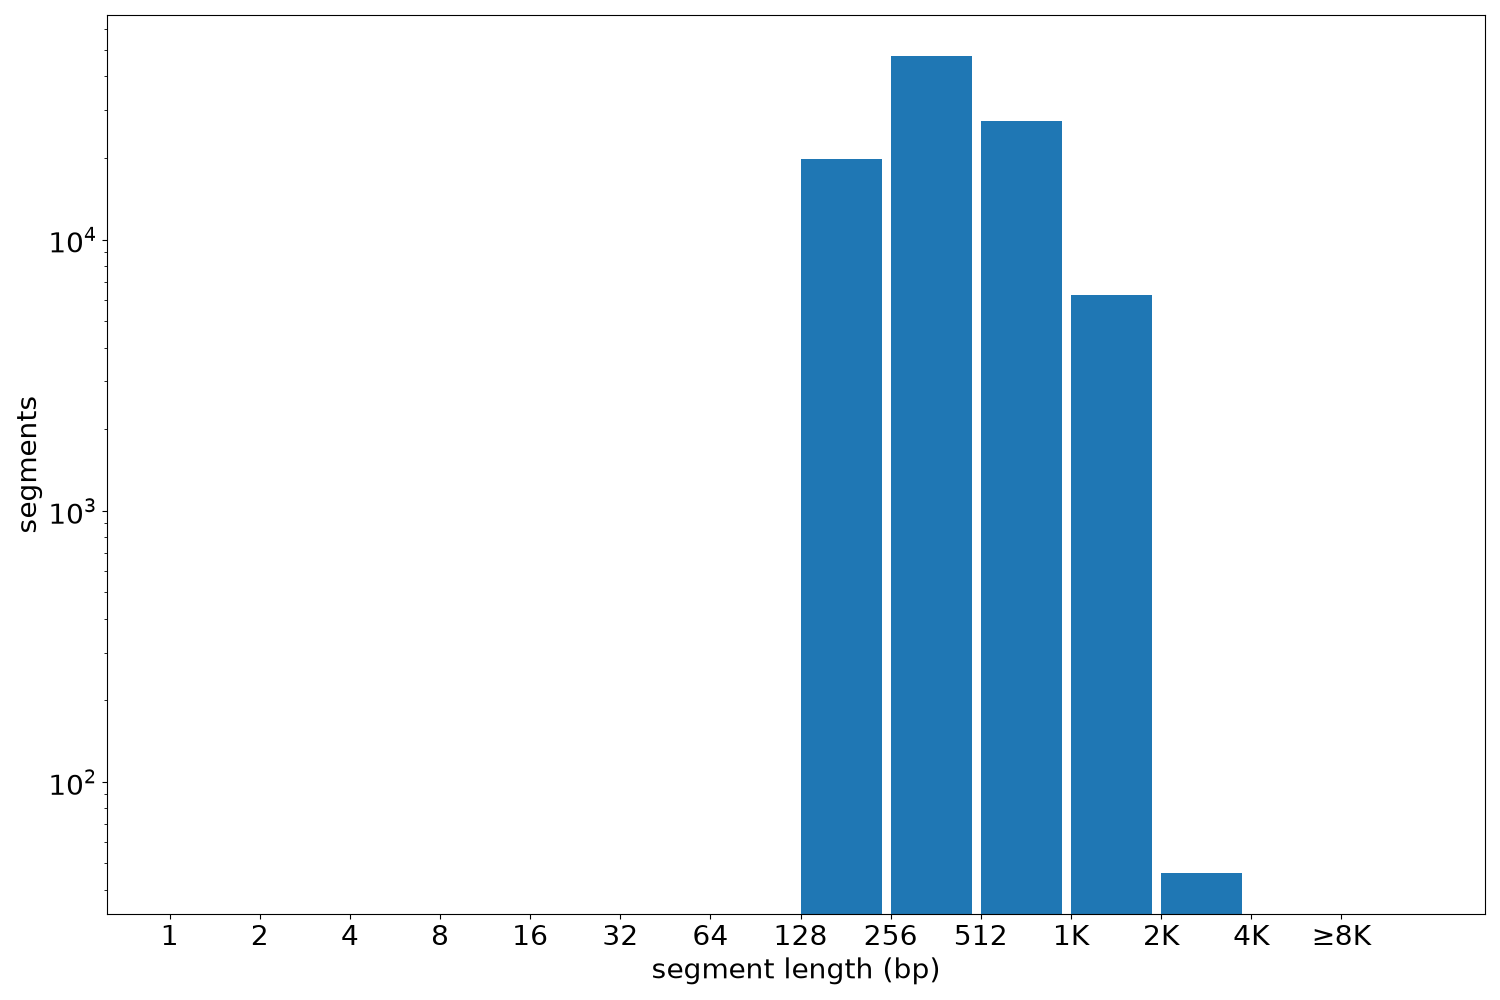
×
Files
| Filename | Size | md5 |
|---|---|---|
| ENCFF026XCY.bed.gz | 3.62 MB | b630a15821d9a543b43e9c0c70b5b7bc |
| ENCFF026XCY.tabix.bed.gz | 1.1 MB | 8d9670a653ed8493a53de6c9f0b215db |
| ENCFF026XCY.tabix.bed.gz.tbi | 412.55 KB | edfbd87b90e5cbfc4dafa3f01111fb22 |
| genomic_resource.yaml | 2.0 KB | a79008d24b8a5f1f941ac0c75a5024d7 |
| statistics/ |