Resource
| Id | ATAC-seq/ENCSR404OEO |
|---|---|
| Type | position_score |
| Version | 0 |
| Summary | ATAC-seq ENCSR404OEO [biosample_summary="Homo sapiens HG02763"] |
| Description |
status: released biological_replicates: Rep 1 summary: output_type: pseudoreplicated peaks audit_internal_action: Released analysis {ENCAN903WJB|/analyses/ENCAN903WJB/} has in progress subobject quality standard {encode4-atac-seq|/quality-standards/encode4-atac-seq/} audit_internal_action: Released analysis {ENCAN903WJB|/analyses/ENCAN903WJB/} has in progress subobject document {21add4c7-fa96-47de-a2d2-326fcf4f81f3|/documents/21add4c7-fa96-47de-a2d2-326fcf4f81f3/} audit_warning: NRF (Non Redundant Fraction) is equal to the result of the division of the number of reads after duplicates removal by the total number of reads. An NRF value < 0.7 is poor complexity, between 0.7 and 0.9 is moderate complexity, and >= 0.9 high complexity. NRF value > 0.9 is recommended, but > 0.7 is acceptable. ENCODE processed file {ENCFF321SNO|/files/ENCFF321SNO/} processed by ATAC-seq ENCODE4 v1.9.1 GRCh38 pipeline was generated from a library with NRF value of 0.715947. audit_warning: PBC1 (PCR Bottlenecking Coefficient 1, M1/M_distinct) is the ratio of the number of genomic locations where exactly one read maps uniquely (M1) to the number of genomic locations where some reads map (M_distinct). A PBC1 value in the range 0 - 0.5 is severe bottlenecking, 0.5 - 0.8 is moderate bottlenecking, 0.8 - 0.9 is mild bottlenecking, and > 0.9 is no bottlenecking. PBC1 value > 0.9 is recommended, but > 0.7 is acceptable. ENCODE processed file {ENCFF321SNO|/files/ENCFF321SNO/} processed by ATAC-seq ENCODE4 v1.9.1 GRCh38 pipeline was generated from a library with a PBC1 value of 0.78. |
| Labels |
|
Scores (1)
| ID | Type | Default annotation | Description | Histogram | Range | Summary |
|---|---|---|---|---|---|---|
| ATAC-seq_ENCSR404OEO | float |
ATAC-seq_ENCSR404OEO |
ATAC-seq ENCSR404OEO [biosample_summary="Homo sapiens HG02763"]
|
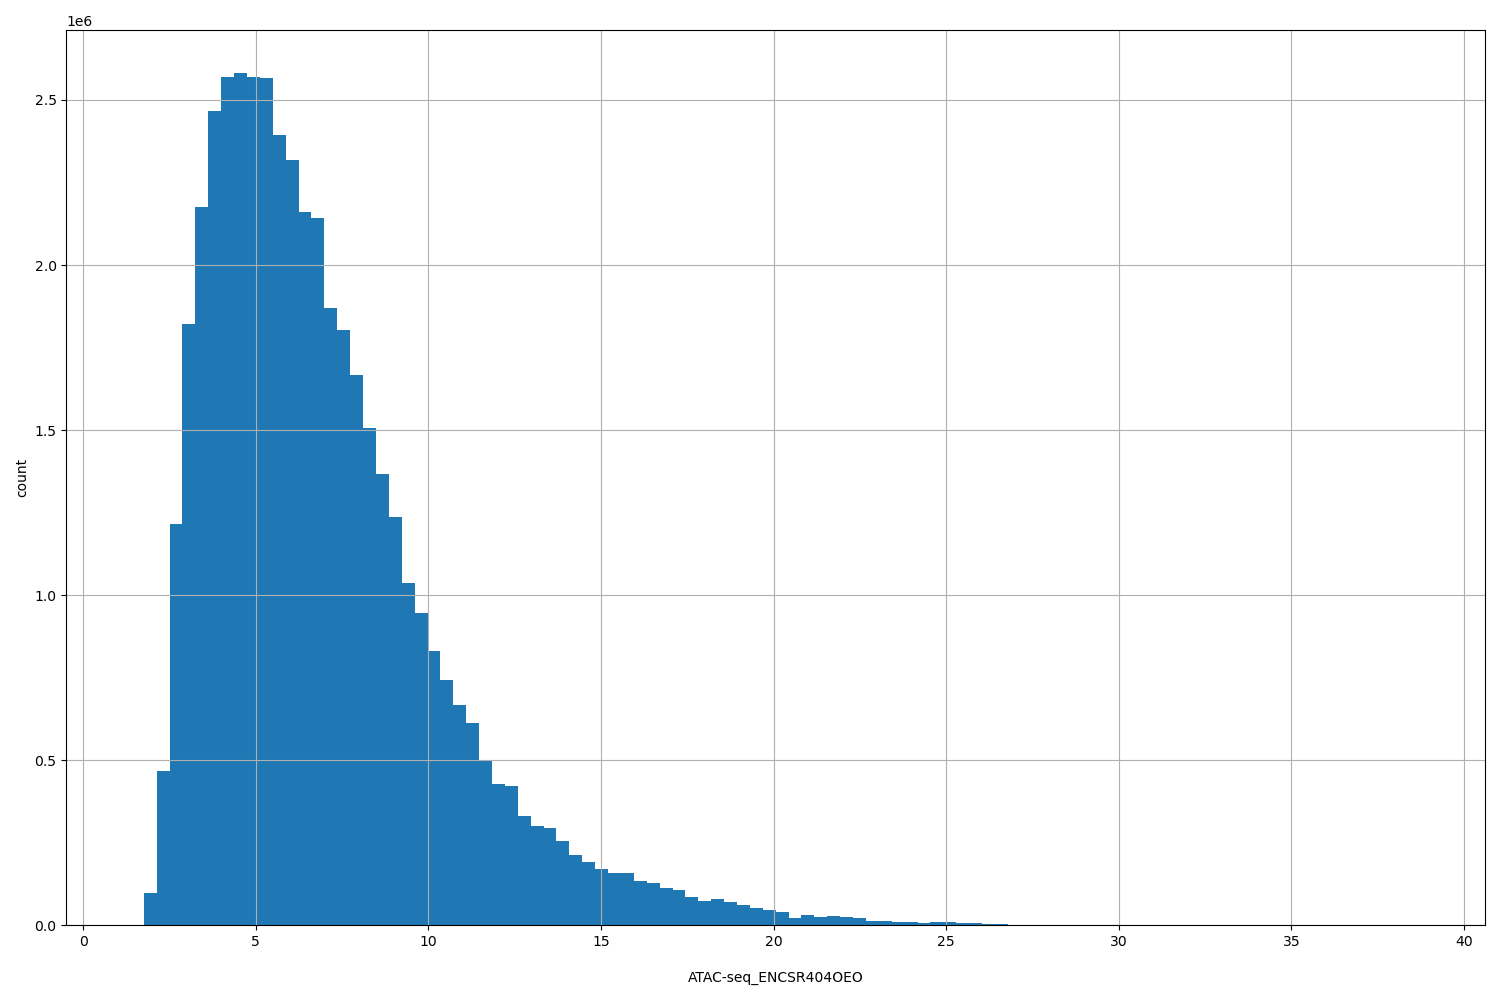 |
[1.38, 38.7] |
|
n counts base pairs; sd is the population standard deviation.
Coverage
| Chromosome | Covered positions | Covered % | Segments |
|---|---|---|---|
| all chromosomes | 46514881 | 1.45% | 89724 |
| chr1 | 4100094 | 1.65% | 7746 |
| chr2 | 4006785 | 1.65% | 7971 |
| chr3 | 3244487 | 1.64% | 6526 |
| chr4 | 2680647 | 1.41% | 5482 |
| chr5 | 2767708 | 1.52% | 5492 |
| chr6 | 3155893 | 1.85% | 6162 |
| chr7 | 2560108 | 1.61% | 5041 |
| chr8 | 2290791 | 1.58% | 4573 |
| chr9 | 1815891 | 1.31% | 3461 |
| chr10 | 2210010 | 1.65% | 4367 |
| chr11 | 2222959 | 1.65% | 4254 |
| chr12 | 2291984 | 1.72% | 4327 |
| chr13 | 1301269 | 1.14% | 2576 |
| chr14 | 1431611 | 1.34% | 2686 |
| chr15 | 1281170 | 1.26% | 2437 |
| chr16 | 1318090 | 1.46% | 2313 |
| chr17 | 1654773 | 1.99% | 2898 |
| chr18 | 1060316 | 1.32% | 2137 |
| chr19 | 1402431 | 2.39% | 2236 |
| chr20 | 975527 | 1.51% | 1856 |
| chr21 | 485904 | 1.04% | 892 |
| chr22 | 661681 | 1.30% | 1140 |
| chrX | 1594173 | 1.02% | 3149 |
| chrY | 579 | <0.01% | 2 |
| 3342 contigs with no values (129077085 bp) | 0 | 0.00% | 0 |
Segment lengths
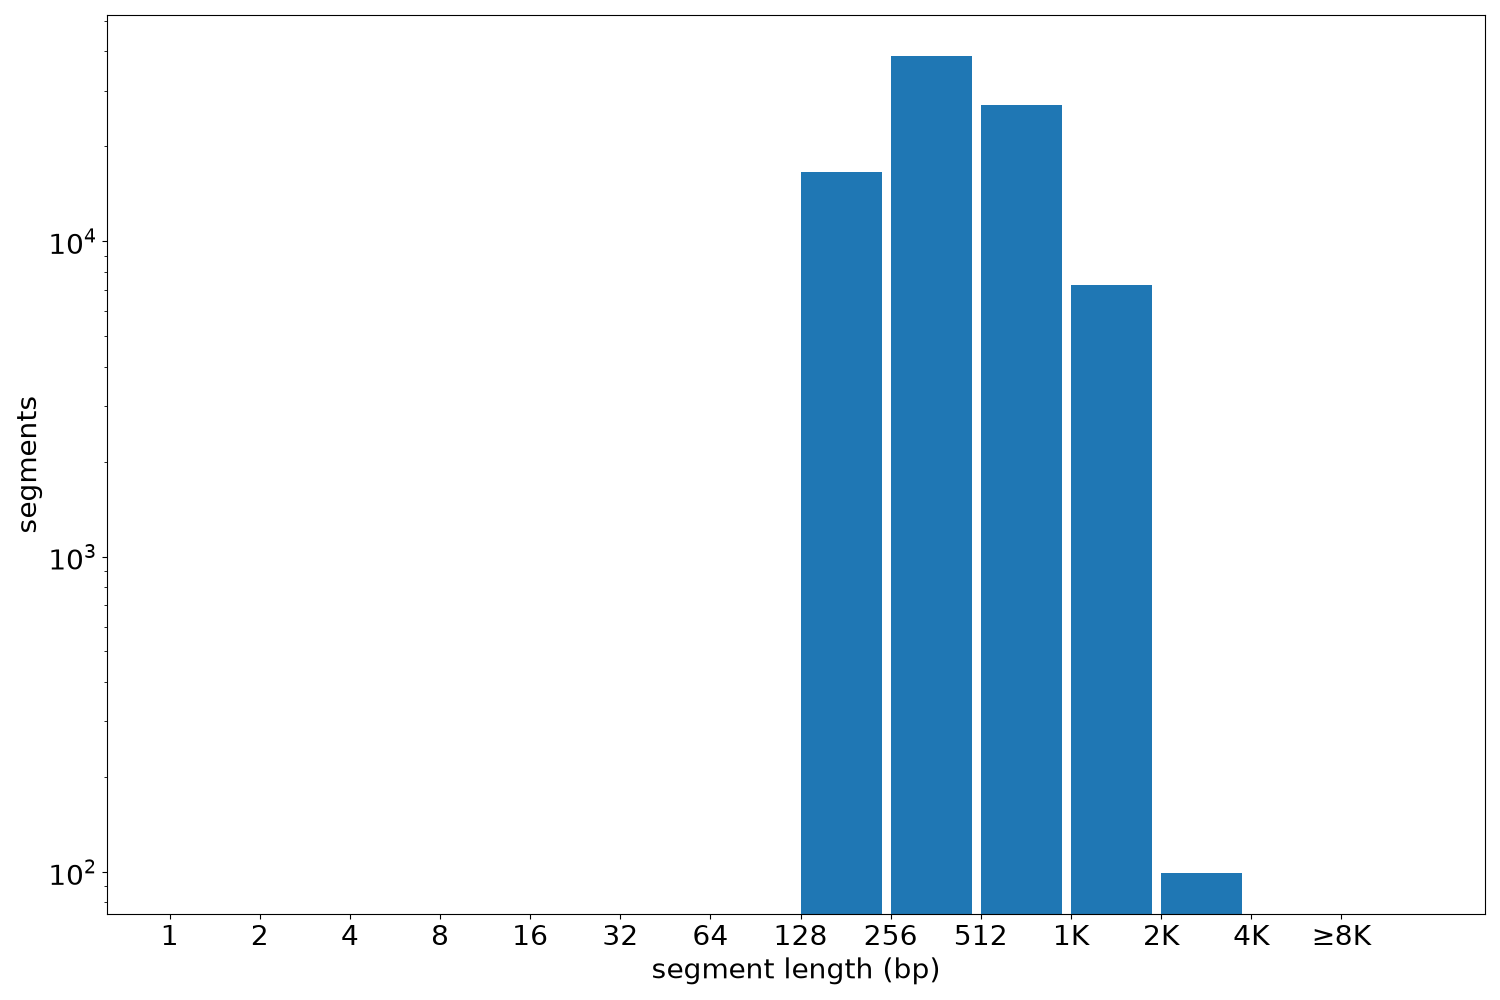
| segments | min | max | mean | median | |
|---|---|---|---|---|---|
| segments | 89724 | 150 | 2887 | 518.42 | 425 |
Files
| Filename | Size | md5 |
|---|---|---|
| ENCFF780FGU.bed.gz | 3.27 MB | 320224e7eae1013efd1995597607a4e8 |
| ENCFF780FGU.tabix.bed.gz | 992.93 KB | f681902b939a4a2583233f42097673b7 |
| ENCFF780FGU.tabix.bed.gz.tbi | 418.01 KB | 367d08a6c48afc62f4f22da39f1921c1 |
| genomic_resource.yaml | 2.71 KB | ff87123372a0497b329c2158236ff386 |
| statistics/ |