Resource
| Id | ATAC-seq/ENCSR381LJX |
|---|---|
| Type | position_score |
| Version | 0 |
| Summary | ATAC-seq ENCSR381LJX [biosample_summary="Homo sapiens HG03039"] |
| Description |
status: released biological_replicates: Rep 1 summary: output_type: pseudoreplicated peaks audit_internal_action: Released analysis {ENCAN173VGV|/analyses/ENCAN173VGV/} has in progress subobject quality standard {encode4-atac-seq|/quality-standards/encode4-atac-seq/} audit_internal_action: Released analysis {ENCAN173VGV|/analyses/ENCAN173VGV/} has in progress subobject document {b7aeb49f-d830-4383-acb0-da4103b7d3e9|/documents/b7aeb49f-d830-4383-acb0-da4103b7d3e9/} audit_warning: NRF (Non Redundant Fraction) is equal to the result of the division of the number of reads after duplicates removal by the total number of reads. An NRF value < 0.7 is poor complexity, between 0.7 and 0.9 is moderate complexity, and >= 0.9 high complexity. NRF value > 0.9 is recommended, but > 0.7 is acceptable. ENCODE processed file {ENCFF231QTG|/files/ENCFF231QTG/} processed by ATAC-seq ENCODE4 v1.9.1 GRCh38 pipeline was generated from a library with NRF value of 0.827071. audit_warning: PBC1 (PCR Bottlenecking Coefficient 1, M1/M_distinct) is the ratio of the number of genomic locations where exactly one read maps uniquely (M1) to the number of genomic locations where some reads map (M_distinct). A PBC1 value in the range 0 - 0.5 is severe bottlenecking, 0.5 - 0.8 is moderate bottlenecking, 0.8 - 0.9 is mild bottlenecking, and > 0.9 is no bottlenecking. PBC1 value > 0.9 is recommended, but > 0.7 is acceptable. ENCODE processed file {ENCFF231QTG|/files/ENCFF231QTG/} processed by ATAC-seq ENCODE4 v1.9.1 GRCh38 pipeline was generated from a library with a PBC1 value of 0.89. |
| Labels |
|
Scores (1)
| ID | Type | Default annotation | Description | Histogram | Range | Summary |
|---|---|---|---|---|---|---|
| ATAC-seq_ENCSR381LJX | float |
ATAC-seq_ENCSR381LJX |
ATAC-seq ENCSR381LJX [biosample_summary="Homo sapiens HG03039"]
|
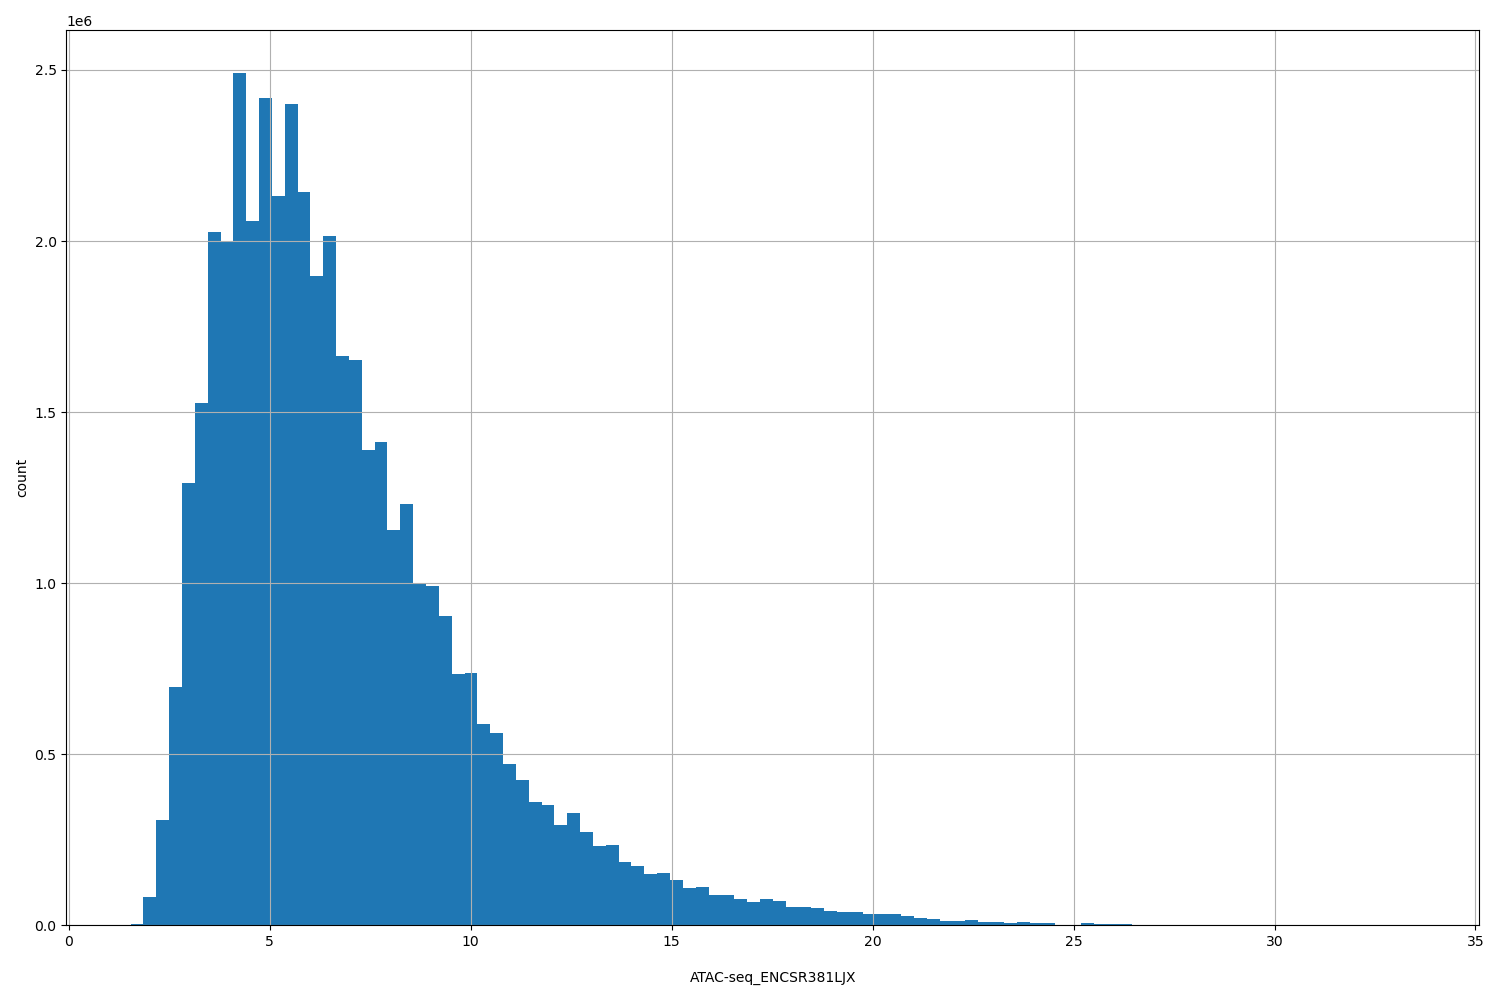 |
[1.53, 33.5] |
|
n counts base pairs; sd is the population standard deviation.
Coverage
| Chromosome | Covered positions | Covered % | Segments |
|---|---|---|---|
| all chromosomes | 44547593 | 1.38% | 86487 |
| chr1 | 4024056 | 1.62% | 7665 |
| chr2 | 3887484 | 1.61% | 7838 |
| chr3 | 3145428 | 1.59% | 6332 |
| chr4 | 2581016 | 1.36% | 5300 |
| chr5 | 2753865 | 1.52% | 5533 |
| chr6 | 3032494 | 1.78% | 5990 |
| chr7 | 2476322 | 1.55% | 4896 |
| chr8 | 2253886 | 1.55% | 4545 |
| chr9 | 1733259 | 1.25% | 3342 |
| chr10 | 2129249 | 1.59% | 4226 |
| chr11 | 2142408 | 1.59% | 4142 |
| chr12 | 2200959 | 1.65% | 4223 |
| chr13 | 1233510 | 1.08% | 2468 |
| chr14 | 1363099 | 1.27% | 2543 |
| chr15 | 1214223 | 1.19% | 2301 |
| chr16 | 1248812 | 1.38% | 2199 |
| chr17 | 1512167 | 1.82% | 2641 |
| chr18 | 1004343 | 1.25% | 2057 |
| chr19 | 1283213 | 2.19% | 2032 |
| chr20 | 945979 | 1.47% | 1807 |
| chr21 | 438571 | 0.94% | 789 |
| chr22 | 569759 | 1.12% | 943 |
| chrX | 1287639 | 0.83% | 2489 |
| chrY | 85852 | 0.15% | 186 |
| 3342 contigs with no values (129077085 bp) | 0 | 0.00% | 0 |
Segment lengths
| segments | min | max | mean | median | |
|---|---|---|---|---|---|
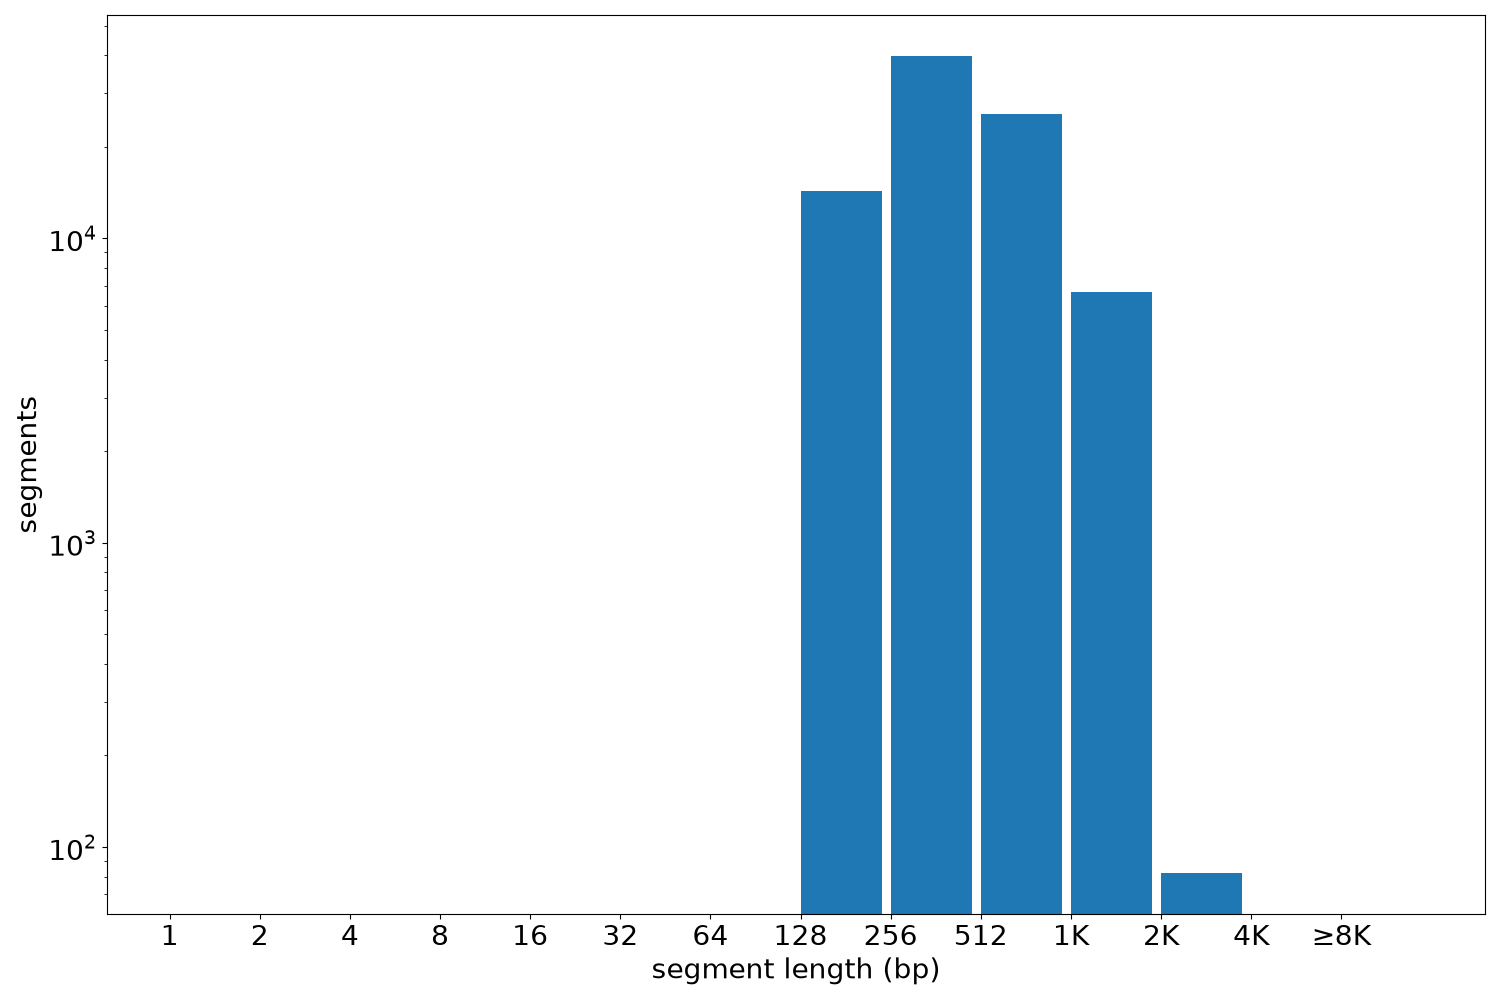
| segments | 86487 | 150 | 2870 | 515.08 | 423 |
Files
| Filename | Size | md5 |
|---|---|---|
| ENCFF299PGG.bed.gz | 3.14 MB | 426b6a573d47ceeb7147b102c64d7847 |
| ENCFF299PGG.tabix.bed.gz | 962.88 KB | 7830240c484c016d8fdb93ab2111f2e0 |
| ENCFF299PGG.tabix.bed.gz.tbi | 409.08 KB | 9226ca86529b47f83f4f433f07cbcc12 |
| genomic_resource.yaml | 2.71 KB | 74afe78c44629a159505a3f53f9321db |
| statistics/ |