Resource
| Id | ATAC-seq/ENCSR379NMT |
|---|---|
| Type | position_score |
| Version | 0 |
| Summary | ATAC-seq ENCSR379NMT [biosample_summary="Homo sapiens stimulated activated naive\ \ B cell male adult (40 years) treated with 1 \u03BCg/mL anti-CD40 for 72 hours,\ \ 10 \u03BCg/mL anti-IgM for 72 hours, 100 ng/mL Interleukin-4 for 72 hours"] |
| Description |
status: released biological_replicates: Rep 1, Rep 2 summary: male adult (40 years) treated with 1 μg/mL anti-CD40 for 72 hours, 10 μg/mL anti-IgM for 72 hours, 100 ng/mL Interleukin-4 for 72 hours output_type: replicated peaks audit_internal_action: Released analysis {ENCAN302DBA|/analyses/ENCAN302DBA/} has in progress subobject quality standard {encode4-atac-seq|/quality-standards/encode4-atac-seq/} |
| Labels |
|
Scores (1)
| ID | Type | Default annotation | Description | Histogram | Range | Summary |
|---|---|---|---|---|---|---|
| ATAC-seq_ENCSR379NMT | float |
ATAC-seq_ENCSR379NMT |
ATAC-seq ENCSR379NMT [biosample_summary="Homo sapiens stimulated activated naive\ \ B cell male adult (40 years) treated with 1 \u03BCg/mL anti-CD40 for 72 hours,\ \ 10 \u03BCg/mL anti-IgM for 72 hours, 100 ng/mL Interleukin-4 for 72 hours"]
|
 |
[1.27, 48.2] |
|
n counts base pairs; sd is the population standard deviation.
Coverage
| Chromosome | Covered positions | Covered % | Segments |
|---|---|---|---|
| all chromosomes | 66030421 | 2.05% | 119396 |
| chr1 | 6238615 | 2.51% | 11114 |
| chr2 | 5229951 | 2.16% | 9708 |
| chr3 | 4199626 | 2.12% | 7818 |
| chr4 | 2866694 | 1.51% | 5481 |
| chr5 | 3366388 | 1.85% | 6321 |
| chr6 | 4098028 | 2.40% | 7479 |
| chr7 | 3382571 | 2.12% | 6179 |
| chr8 | 2906269 | 2.00% | 5470 |
| chr9 | 2769902 | 2.00% | 5055 |
| chr10 | 3092106 | 2.31% | 5664 |
| chr11 | 3242843 | 2.40% | 5711 |
| chr12 | 3262225 | 2.45% | 5888 |
| chr13 | 1633611 | 1.43% | 3097 |
| chr14 | 2183574 | 2.04% | 3912 |
| chr15 | 2080463 | 2.04% | 3754 |
| chr16 | 2318954 | 2.57% | 3934 |
| chr17 | 3070765 | 3.69% | 5146 |
| chr18 | 1430850 | 1.78% | 2768 |
| chr19 | 2672394 | 4.56% | 4256 |
| chr20 | 1785288 | 2.77% | 3246 |
| chr21 | 892522 | 1.91% | 1591 |
| chr22 | 1445998 | 2.85% | 2417 |
| chrX | 1755248 | 1.12% | 3182 |
| chrY | 105536 | 0.18% | 205 |
| 3342 contigs with no values (129077085 bp) | 0 | 0.00% | 0 |
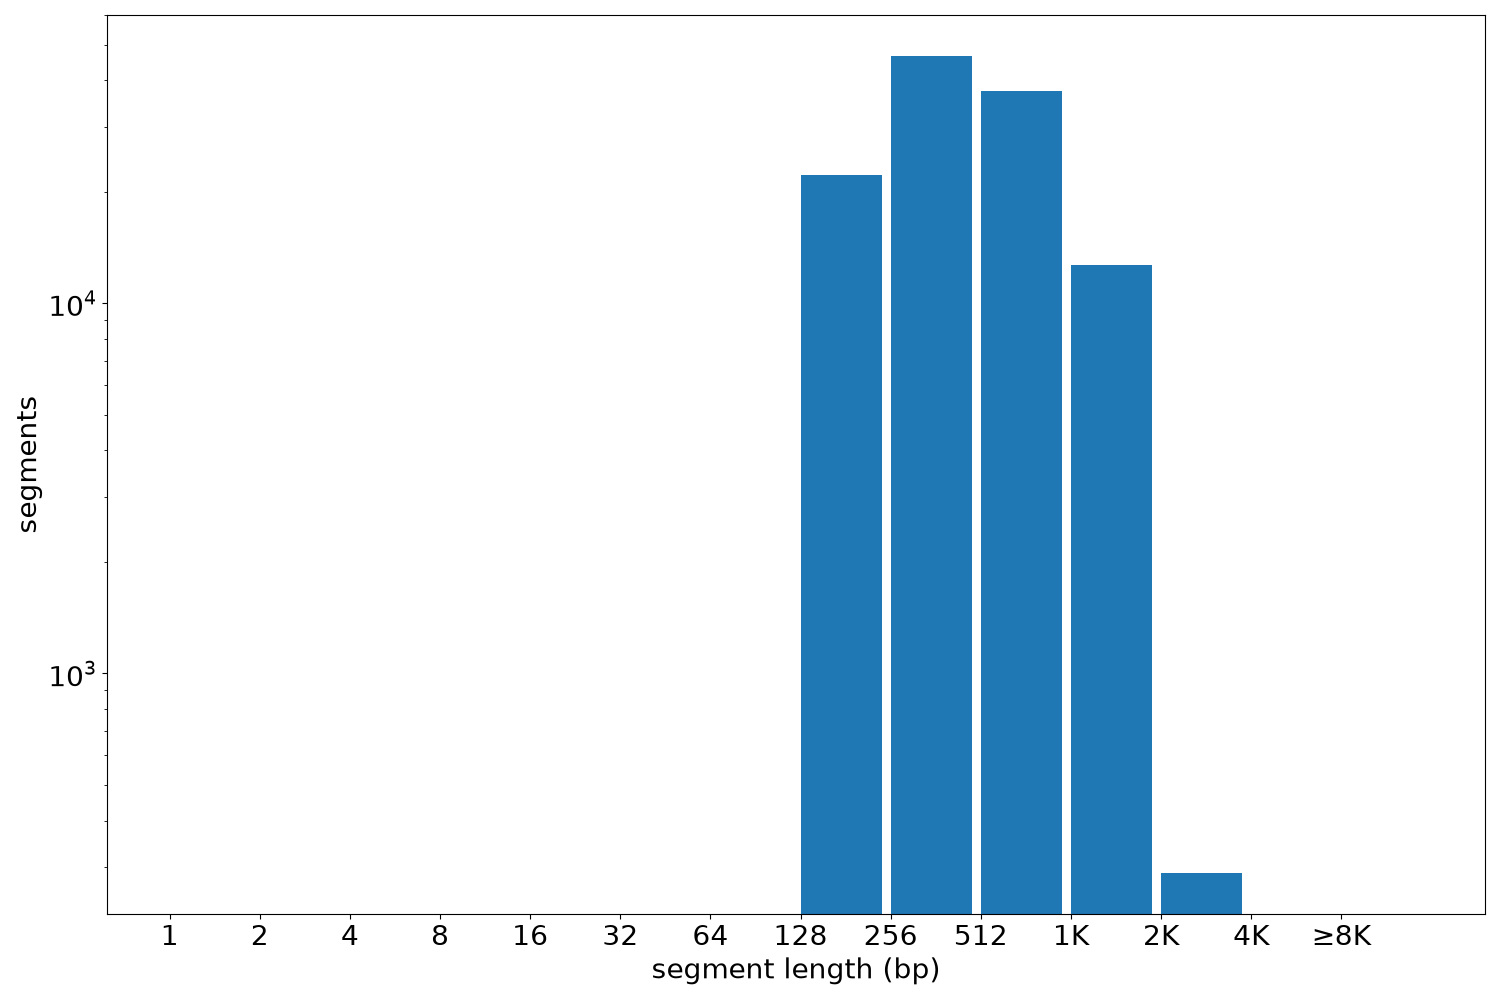
Segment lengths
| segments | min | max | mean | median | |
|---|---|---|---|---|---|
| segments | 119396 | 150 | 3391 | 553.04 | 446 |
×
Files
| Filename | Size | md5 |
|---|---|---|
| ENCFF587QZR.bed.gz | 4.73 MB | 55dda65dff896428c4ad04e47e913aea |
| ENCFF587QZR.tabix.bed.gz | 1.3 MB | 8fb029bca9f77e8e10f071952645f7c3 |
| ENCFF587QZR.tabix.bed.gz.tbi | 469.32 KB | 21c9925160c74eb3d3517db5411865cc |
| genomic_resource.yaml | 2.13 KB | d7d0b07475b9e5718cd57f6d81753e57 |
| statistics/ |