Resource
| Id | ATAC-seq/ENCSR325NFE |
|---|---|
| Type | position_score |
| Version | 0 |
| Summary | ATAC-seq ENCSR325NFE [biosample_summary="Homo sapiens bile duct tissue female child (16 years)"] |
| Description |
status: released biological_replicates: Rep 1 summary: female child (16 years) output_type: pseudoreplicated peaks audit_internal_action: Released analysis {ENCAN017XQA|/analyses/ENCAN017XQA/} has in progress subobject quality standard {encode4-atac-seq|/quality-standards/encode4-atac-seq/} audit_not_compliant: According to ENCODE4 standards, overlap peaks files in ATAC-seq assays processed by the uniform processing pipeline should have FRiP (fraction of reads in called peak regions) scores > 0.3. FRiP scores 0.2-0.3 are acceptable, and < 0.2 are not compliant. {ENCFF201LZO|/files/ENCFF201LZO/} processed by ATAC-seq ENCODE4 v1.9.1 GRCh38 pipeline has a FRiP score of 0.17. audit_warning: NRF (Non Redundant Fraction) is equal to the result of the division of the number of reads after duplicates removal by the total number of reads. An NRF value < 0.7 is poor complexity, between 0.7 and 0.9 is moderate complexity, and >= 0.9 high complexity. NRF value > 0.9 is recommended, but > 0.7 is acceptable. ENCODE processed file {ENCFF822VZJ|/files/ENCFF822VZJ/} processed by ATAC-seq ENCODE4 v1.9.1 GRCh38 pipeline was generated from a library with NRF value of 0.816873. audit_warning: PBC1 (PCR Bottlenecking Coefficient 1, M1/M_distinct) is the ratio of the number of genomic locations where exactly one read maps uniquely (M1) to the number of genomic locations where some reads map (M_distinct). A PBC1 value in the range 0 - 0.5 is severe bottlenecking, 0.5 - 0.8 is moderate bottlenecking, 0.8 - 0.9 is mild bottlenecking, and > 0.9 is no bottlenecking. PBC1 value > 0.9 is recommended, but > 0.7 is acceptable. ENCODE processed file {ENCFF822VZJ|/files/ENCFF822VZJ/} processed by ATAC-seq ENCODE4 v1.9.1 GRCh38 pipeline was generated from a library with a PBC1 value of 0.83. |
| Labels |
|
Scores (1)
| ID | Type | Default annotation | Description | Histogram | Range | Summary |
|---|---|---|---|---|---|---|
| ATAC-seq_ENCSR325NFE | float |
ATAC-seq_ENCSR325NFE |
ATAC-seq ENCSR325NFE [biosample_summary="Homo sapiens bile duct tissue female child (16 years)"]
|
 |
[1.29, 29.4] |
|
n counts base pairs; sd is the population standard deviation.
Coverage
| Chromosome | Covered positions | Covered % | Segments |
|---|---|---|---|
| all chromosomes | 86693658 | 2.69% | 137956 |
| chr1 | 8169612 | 3.28% | 12772 |
| chr2 | 7095274 | 2.93% | 11500 |
| chr3 | 5461879 | 2.75% | 8935 |
| chr4 | 3767016 | 1.98% | 6344 |
| chr5 | 4554955 | 2.51% | 7503 |
| chr6 | 4883366 | 2.86% | 7972 |
| chr7 | 4525888 | 2.84% | 7328 |
| chr8 | 3742621 | 2.58% | 6157 |
| chr9 | 3944381 | 2.85% | 6261 |
| chr10 | 4429520 | 3.31% | 7182 |
| chr11 | 4391452 | 3.25% | 6768 |
| chr12 | 4187020 | 3.14% | 6657 |
| chr13 | 2177885 | 1.90% | 3595 |
| chr14 | 2746205 | 2.57% | 4359 |
| chr15 | 3069874 | 3.01% | 4845 |
| chr16 | 2987713 | 3.31% | 4479 |
| chr17 | 4046623 | 4.86% | 6031 |
| chr18 | 1825804 | 2.27% | 3103 |
| chr19 | 3091449 | 5.27% | 4318 |
| chr20 | 2414703 | 3.75% | 3815 |
| chr21 | 1122828 | 2.40% | 1780 |
| chr22 | 1881813 | 3.70% | 2848 |
| chrX | 2172968 | 1.39% | 3395 |
| chrY | 2809 | <0.01% | 9 |
| 3342 contigs with no values (129077085 bp) | 0 | 0.00% | 0 |
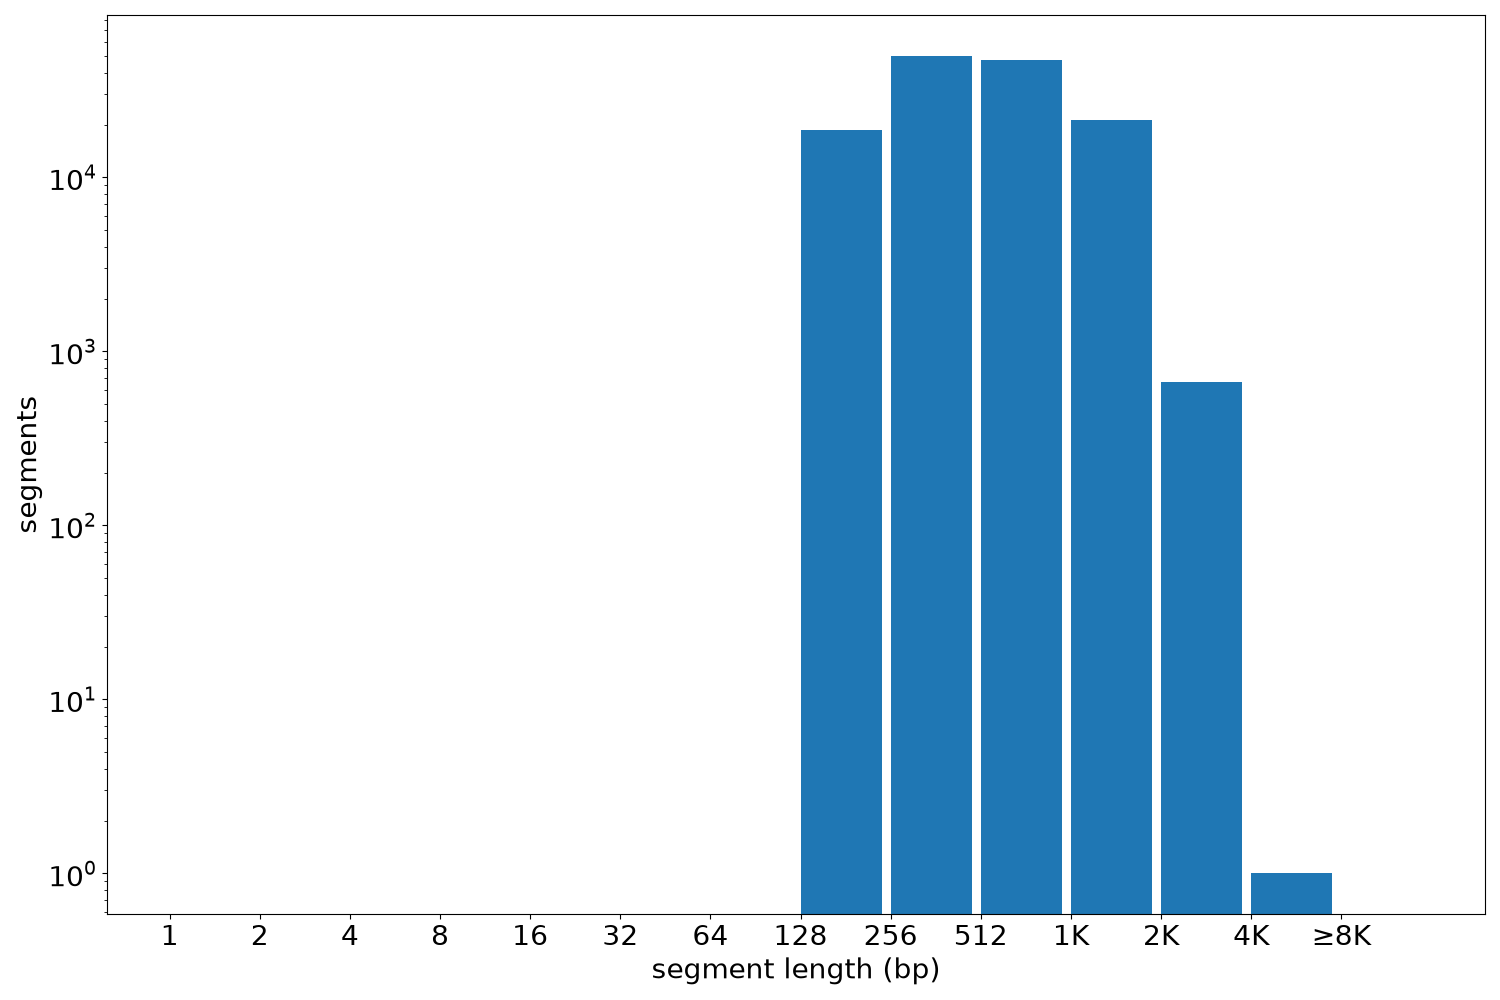
Segment lengths
| segments | min | max | mean | median | |
|---|---|---|---|---|---|
| segments | 137956 | 150 | 4330 | 628.42 | 514 |
Files
| Filename | Size | md5 |
|---|---|---|
| ENCFF201LZO.bed.gz | 5.42 MB | 0b5c83dddde7859390722ecf3ec205ef |
| ENCFF201LZO.tabix.bed.gz | 1.52 MB | a6461d0172c4f2e3171ff0f1d9a24377 |
| ENCFF201LZO.tabix.bed.gz.tbi | 478.18 KB | 69fb855db7d465cf16367d725827ef3f |
| genomic_resource.yaml | 3.33 KB | 824b57c69b95720b1b0301192382c13f |
| statistics/ |