Resource
| Id | ATAC-seq/ENCSR261PWP |
|---|---|
| Type | position_score |
| Version | 0 |
| Summary | ATAC-seq ENCSR261PWP [biosample_summary="Homo sapiens activated CD4-positive, CD25-positive, alpha-beta regulatory T cell male adult (42 years) treated with anti-CD3 and anti-CD28 coated beads for 24 hours, 50 U/mL Interleukin-2 for 24 hours"] |
| Description |
status: released biological_replicates: Rep 1 summary: male adult (42 years) treated with anti-CD3 and anti-CD28 coated beads for 24 hours, 50 U/mL Interleukin-2 for 24 hours output_type: pseudoreplicated peaks audit_internal_action: Released analysis {ENCAN555ZRF|/analyses/ENCAN555ZRF/} has in progress subobject quality standard {encode4-atac-seq|/quality-standards/encode4-atac-seq/} |
| Labels |
|
Scores (1)
| ID | Type | Default annotation | Description | Histogram | Range | Summary |
|---|---|---|---|---|---|---|
| ATAC-seq_ENCSR261PWP | float |
ATAC-seq_ENCSR261PWP |
ATAC-seq ENCSR261PWP [biosample_summary="Homo sapiens activated CD4-positive, CD25-positive, alpha-beta regulatory T cell male adult (42 years) treated with anti-CD3 and anti-CD28 coated beads for 24 hours, 50 U/mL Interleukin-2 for 24 hours"]
|
 |
[1.34, 42.8] |
|
n counts base pairs; sd is the population standard deviation.
Coverage
| Chromosome | Covered positions | Covered % | Segments |
|---|---|---|---|
| all chromosomes | 42859834 | 1.33% | 87874 |
| chr1 | 4264382 | 1.71% | 8645 |
| chr2 | 3425574 | 1.41% | 7238 |
| chr3 | 2746869 | 1.39% | 5769 |
| chr4 | 1632461 | 0.86% | 3409 |
| chr5 | 2046007 | 1.13% | 4274 |
| chr6 | 2658922 | 1.56% | 5529 |
| chr7 | 2087473 | 1.31% | 4299 |
| chr8 | 1772250 | 1.22% | 3697 |
| chr9 | 1664742 | 1.20% | 3383 |
| chr10 | 2047276 | 1.53% | 4267 |
| chr11 | 2075637 | 1.54% | 4269 |
| chr12 | 2179973 | 1.64% | 4439 |
| chr13 | 1010665 | 0.88% | 2170 |
| chr14 | 1491327 | 1.39% | 3069 |
| chr15 | 1429178 | 1.40% | 3005 |
| chr16 | 1553841 | 1.72% | 3062 |
| chr17 | 2163638 | 2.60% | 4226 |
| chr18 | 767406 | 0.95% | 1670 |
| chr19 | 1867713 | 3.19% | 3451 |
| chr20 | 1108155 | 1.72% | 2266 |
| chr21 | 586829 | 1.26% | 1178 |
| chr22 | 957214 | 1.88% | 1879 |
| chrX | 1246183 | 0.80% | 2505 |
| chrY | 76119 | 0.13% | 175 |
| 3342 contigs with no values (129077085 bp) | 0 | 0.00% | 0 |
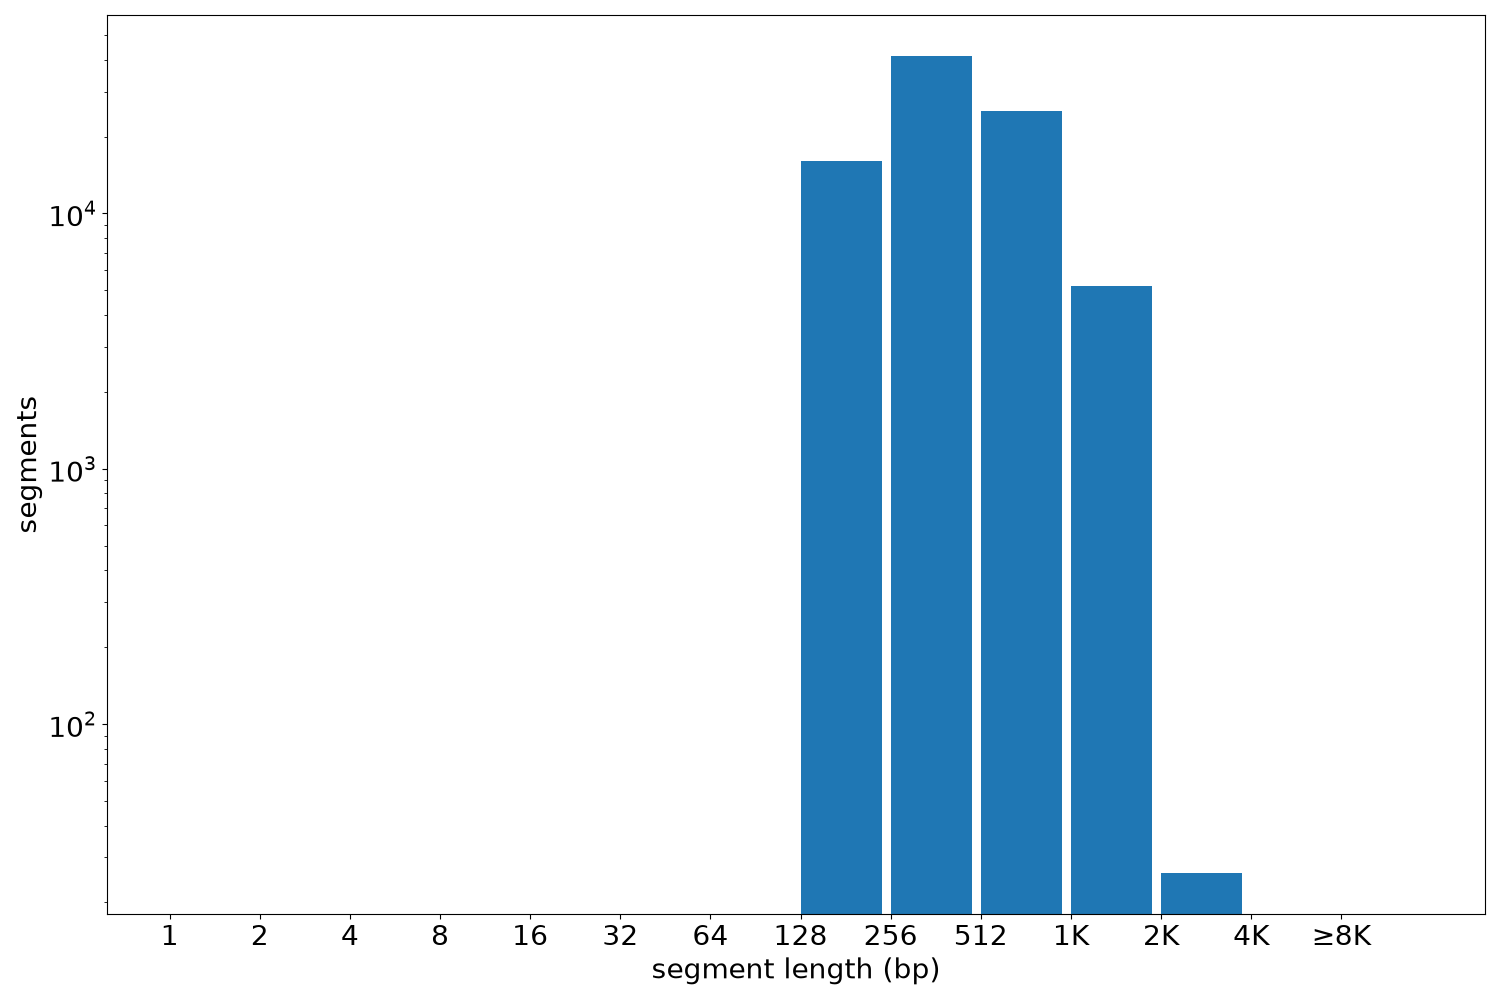
Segment lengths
| segments | min | max | mean | median | |
|---|---|---|---|---|---|
| segments | 87874 | 150 | 2428 | 487.74 | 402 |
×
Files
| Filename | Size | md5 |
|---|---|---|
| ENCFF456OPK.bed.gz | 3.07 MB | da5ca4de6ea9d542a799752b670ad8df |
| ENCFF456OPK.tabix.bed.gz | 973.28 KB | f4aa0b41539b201bae308661612fa972 |
| ENCFF456OPK.tabix.bed.gz.tbi | 360.89 KB | 93cf1d757c81ded87dceef114f95e3dc |
| genomic_resource.yaml | 2.05 KB | 07a297d1d05213957f9b0d91f98bffef |
| statistics/ |