Resource
| Id | ATAC-seq/ENCSR105SCQ |
|---|---|
| Type | position_score |
| Version | 0 |
| Summary | ATAC-seq ENCSR105SCQ [biosample_summary="Homo sapiens GM21360"] |
| Description |
status: released biological_replicates: Rep 1 summary: output_type: pseudoreplicated peaks audit_internal_action: Released analysis {ENCAN655EAQ|/analyses/ENCAN655EAQ/} has in progress subobject quality standard {encode4-atac-seq|/quality-standards/encode4-atac-seq/} audit_internal_action: Released analysis {ENCAN655EAQ|/analyses/ENCAN655EAQ/} has in progress subobject document {b6b7ba0b-3553-4198-b222-d4d07354a2f7|/documents/b6b7ba0b-3553-4198-b222-d4d07354a2f7/} audit_warning: NRF (Non Redundant Fraction) is equal to the result of the division of the number of reads after duplicates removal by the total number of reads. An NRF value < 0.7 is poor complexity, between 0.7 and 0.9 is moderate complexity, and >= 0.9 high complexity. NRF value > 0.9 is recommended, but > 0.7 is acceptable. ENCODE processed file {ENCFF991ZNJ|/files/ENCFF991ZNJ/} processed by ATAC-seq ENCODE4 v1.9.1 GRCh38 pipeline was generated from a library with NRF value of 0.718356. audit_warning: PBC1 (PCR Bottlenecking Coefficient 1, M1/M_distinct) is the ratio of the number of genomic locations where exactly one read maps uniquely (M1) to the number of genomic locations where some reads map (M_distinct). A PBC1 value in the range 0 - 0.5 is severe bottlenecking, 0.5 - 0.8 is moderate bottlenecking, 0.8 - 0.9 is mild bottlenecking, and > 0.9 is no bottlenecking. PBC1 value > 0.9 is recommended, but > 0.7 is acceptable. ENCODE processed file {ENCFF991ZNJ|/files/ENCFF991ZNJ/} processed by ATAC-seq ENCODE4 v1.9.1 GRCh38 pipeline was generated from a library with a PBC1 value of 0.85. |
| Labels |
|
Scores (1)
| ID | Type | Default annotation | Description | Histogram | Range | Summary |
|---|---|---|---|---|---|---|
| ATAC-seq_ENCSR105SCQ | float |
ATAC-seq_ENCSR105SCQ |
ATAC-seq ENCSR105SCQ [biosample_summary="Homo sapiens GM21360"]
|
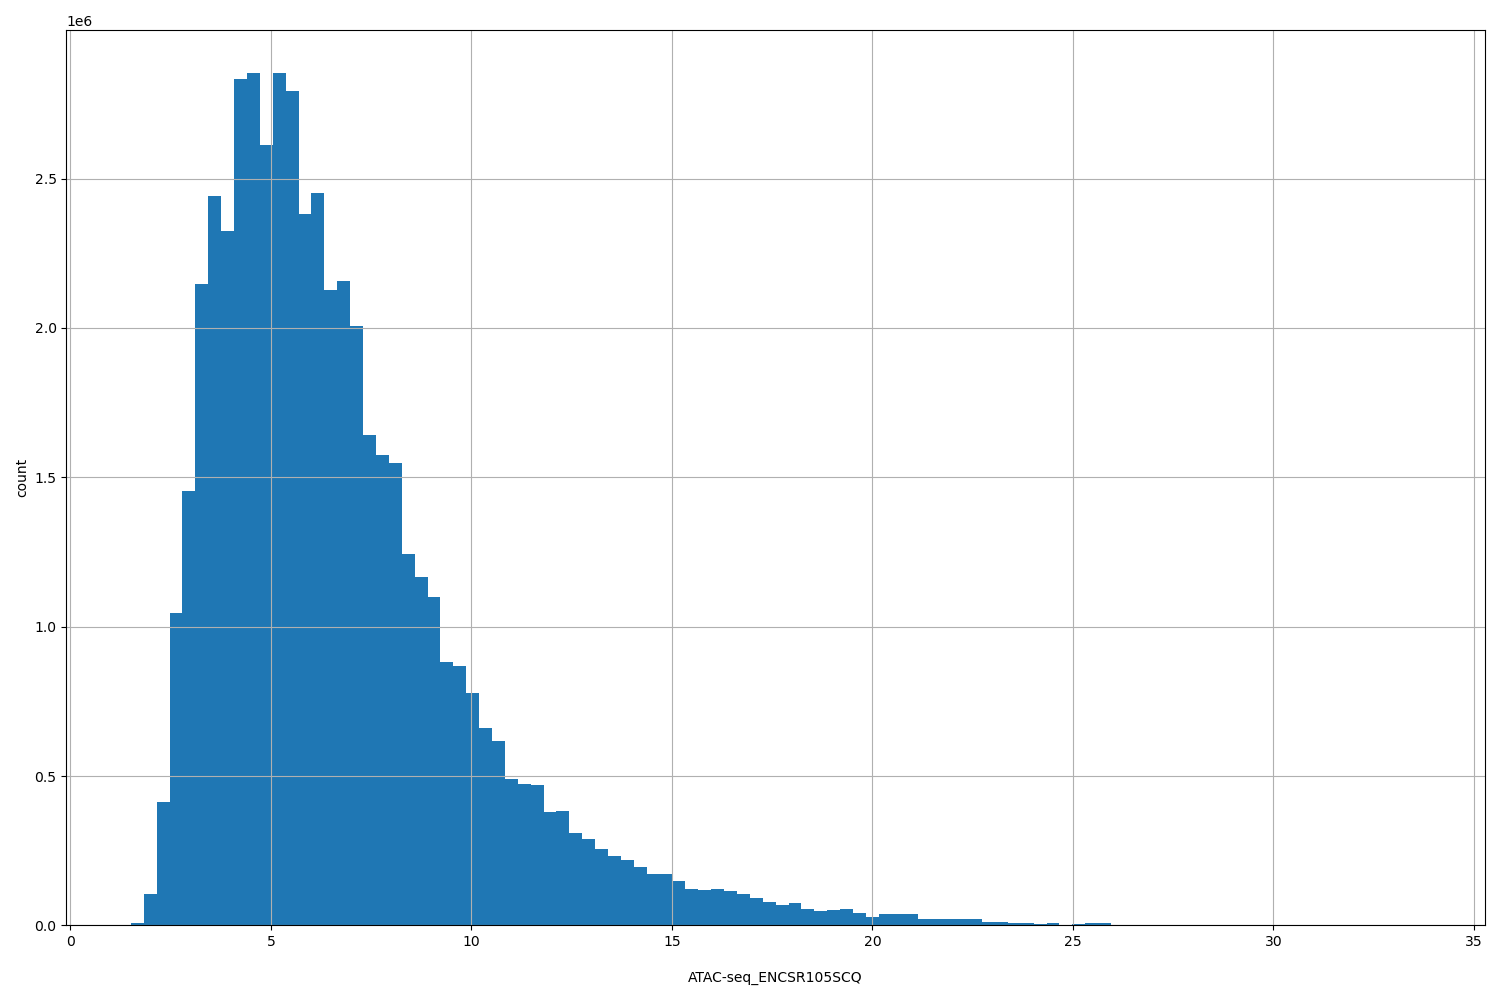 |
[1.51, 33.7] |
|
n counts base pairs; sd is the population standard deviation.
Coverage
| Chromosome | Covered positions | Covered % | Segments |
|---|---|---|---|
| all chromosomes | 52749275 | 1.64% | 99595 |
| chr1 | 4679286 | 1.88% | 8678 |
| chr2 | 4602339 | 1.90% | 8934 |
| chr3 | 3680151 | 1.86% | 7107 |
| chr4 | 3073417 | 1.62% | 6115 |
| chr5 | 3267291 | 1.80% | 6368 |
| chr6 | 3525123 | 2.06% | 6702 |
| chr7 | 2965991 | 1.86% | 5671 |
| chr8 | 2643984 | 1.82% | 5198 |
| chr9 | 2071035 | 1.50% | 3959 |
| chr10 | 2498072 | 1.87% | 4743 |
| chr11 | 2571302 | 1.90% | 4856 |
| chr12 | 2589235 | 1.94% | 4851 |
| chr13 | 1429468 | 1.25% | 2755 |
| chr14 | 1586611 | 1.48% | 2926 |
| chr15 | 1453689 | 1.43% | 2671 |
| chr16 | 1465859 | 1.62% | 2568 |
| chr17 | 1773166 | 2.13% | 3050 |
| chr18 | 1205645 | 1.50% | 2373 |
| chr19 | 1481223 | 2.53% | 2300 |
| chr20 | 1142207 | 1.77% | 2122 |
| chr21 | 470943 | 1.01% | 822 |
| chr22 | 658330 | 1.30% | 1103 |
| chrX | 1913975 | 1.23% | 3720 |
| chrY | 933 | <0.01% | 3 |
| 3342 contigs with no values (129077085 bp) | 0 | 0.00% | 0 |
Segment lengths
| segments | min | max | mean | median | |
|---|---|---|---|---|---|
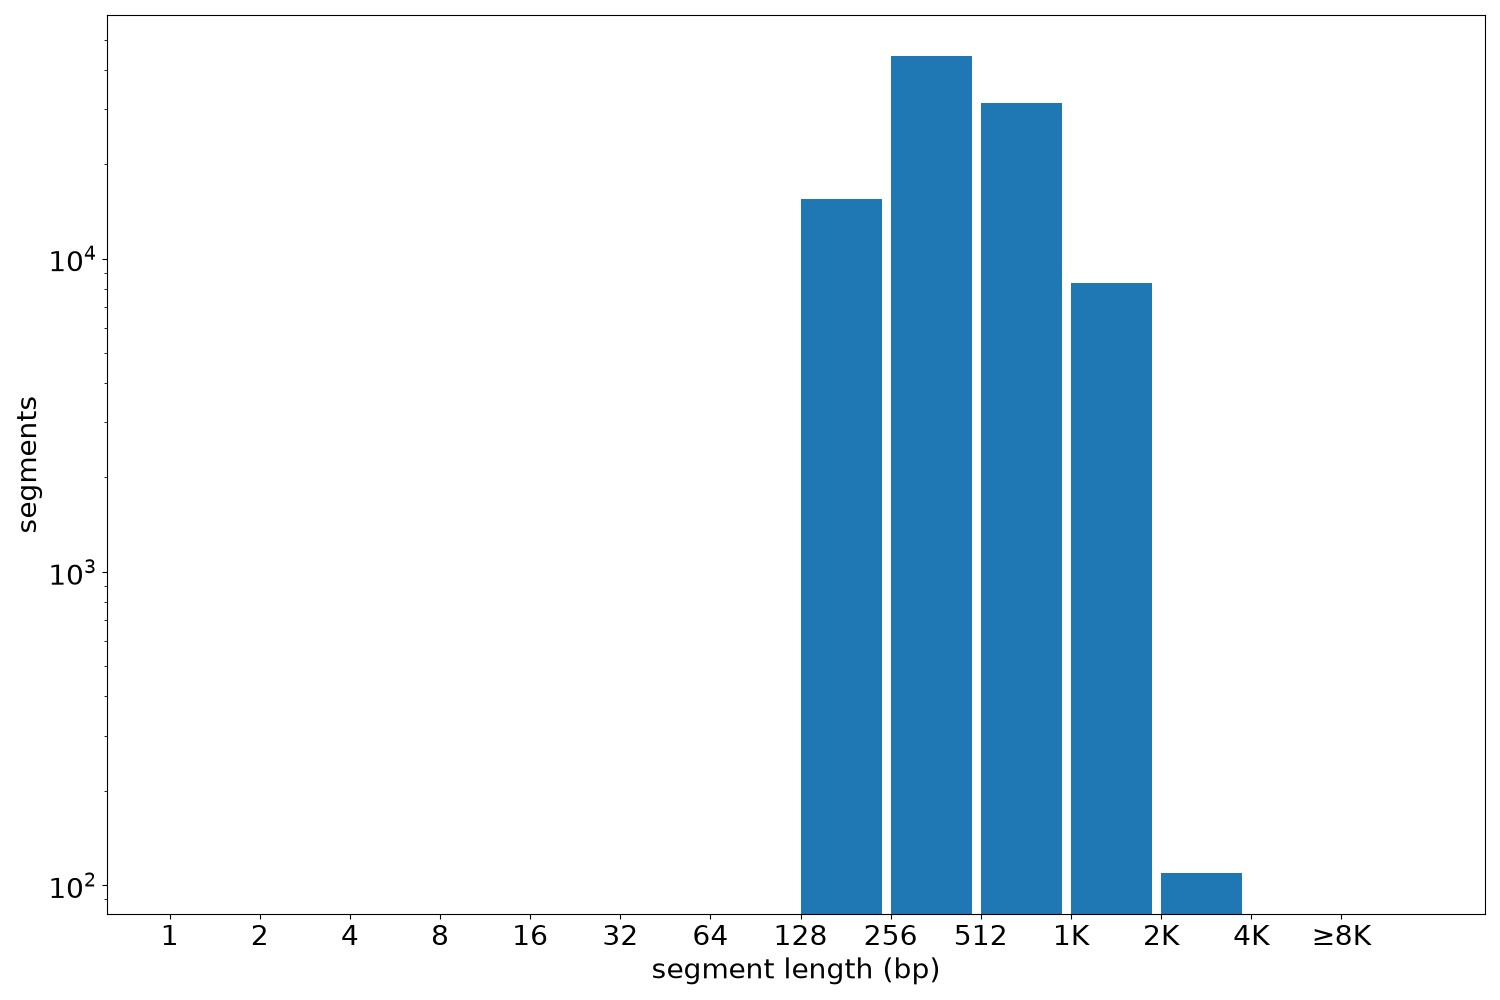
| segments | 99595 | 150 | 2895 | 529.64 | 439 |
Files
| Filename | Size | md5 |
|---|---|---|
| ENCFF091ELX.bed.gz | 3.7 MB | 97b67dc632e3e8b2b685f670c5e524fd |
| ENCFF091ELX.tabix.bed.gz | 1.08 MB | 2d482ef52ef6d49eb1db978db7a3d5b6 |
| ENCFF091ELX.tabix.bed.gz.tbi | 446.58 KB | 677b90467e276cfc669549e6b2c1fead |
| genomic_resource.yaml | 2.71 KB | 479bf72a4331a4e8a90b2ad8fb7e1324 |
| statistics/ |